Automating Telecom Cabinet Power Controller Monitoring Data Analysis with Python Scripts


You can streamline your daily workflow by using Python scripts to process data from a Telecom Cabinet Power Controller. These scripts let you avoid manual calculations and reduce the chance of errors. By automating data analysis, you gain faster results and more accurate insights. Many telecom engineers trust this approach because it saves time and improves reliability.
Tip: Automation frees you to focus on problem-solving instead of repetitive tasks.
Key Takeaways
Use Python scripts to automate data analysis and reduce manual work, saving time and improving accuracy.
Monitor key metrics like current, voltage, temperature, and humidity continuously to prevent equipment failures and downtime.
Set up a Python environment with essential libraries such as pandas, numpy, and matplotlib to handle data processing and visualization.
Clean and prepare your data carefully by fixing missing values and removing duplicates to ensure reliable analysis.
Automate trend detection, anomaly detection, and report generation to support proactive maintenance and better decision-making.
Data in Telecom Cabinet Power Controller
Data Types and Formats
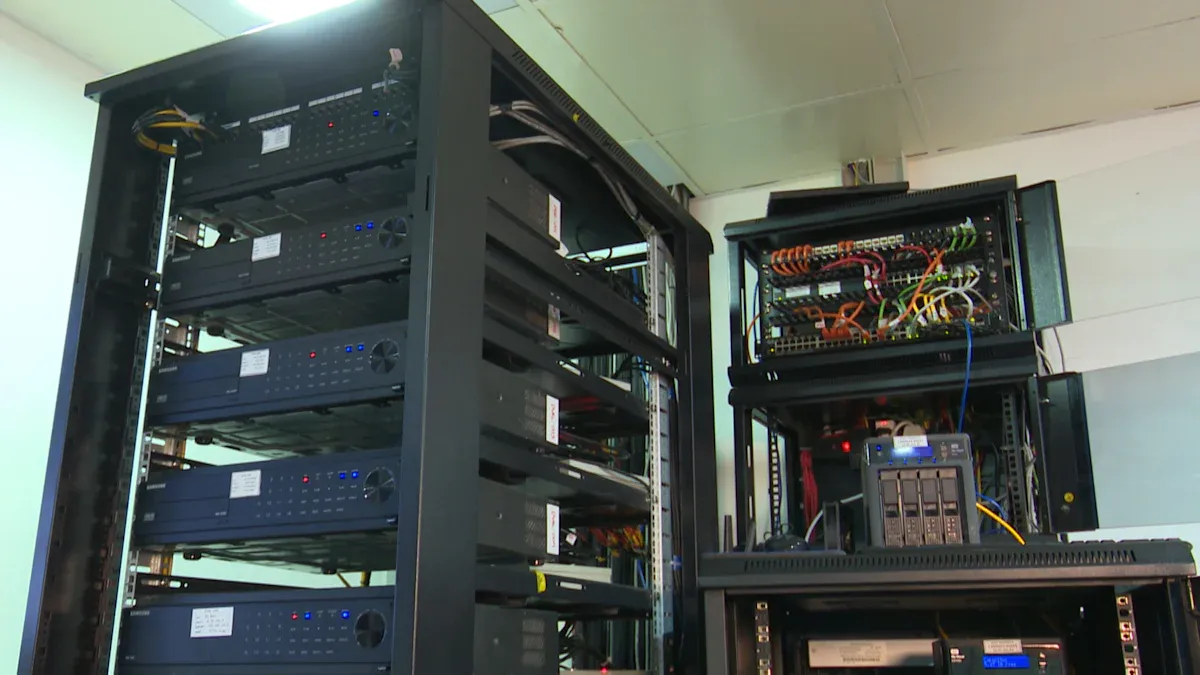
You will encounter a variety of data types when working with a Telecom Cabinet Power Controller. These devices generate both electrical and environmental data. Electrical data includes current, voltage, power, and energy consumption. Environmental data covers temperature and humidity readings. Most controllers output data in formats such as CSV, JSON, or XML. Some advanced systems use SNMP or REST APIs for real-time data sharing.
You may face challenges due to the diversity of hardware and data formats. Each manufacturer might use a different structure or protocol. This means you need flexible scripts that can adapt to multiple formats. You also need to ensure secure and reliable data sharing, especially if you manage many sites. Using Python, you can write scripts that handle these formats and automate the import process.
Note: Consistent data formatting makes it easier to analyze trends and detect anomalies across different sites.
Key Metrics
To monitor and maintain your telecom cabinet, you should focus on several key metrics. These metrics help you ensure system reliability and prevent downtime. The table below summarizes the most important ones:
Key Metric | Purpose | Importance for Performance |
|---|---|---|
Current (Amperes) | Maintain safe load balance | Prevents overloads and ensures stable current flow |
Voltage (Volts) | Ensure stable power delivery | Protects equipment from voltage fluctuations |
Active Power (Watts) | Track real-time power consumption | Helps manage capacity and operational load |
Apparent Power (kVA) | Assess total power demand | Improves power quality and system reliability |
Energy Consumption (kWh) | Monitor cumulative energy usage | Identifies efficiency trends and long-term consumption |
Temperature | Maintain optimal environmental conditions | Extends equipment lifespan by preventing overheating |
Humidity | Control moisture levels | Prevents moisture damage and equipment failure |
You should monitor these metrics continuously. Intelligent PDUs and IoT sensors collect this data in real time. Frequent data collection allows you to spot temperature spikes, voltage drops, or power failures early. This proactive approach helps you avoid outages and maintain high uptime.
Real-time monitoring supports early anomaly detection and load balancing.
Environmental metrics like temperature and humidity protect equipment from damage.
Automation and AI-driven analytics use these metrics for predictive maintenance.
By focusing on these data types and metrics, you set a strong foundation for automating your analysis workflow.
Python Environment Setup
Libraries and Tools
You need the right set of Python libraries to analyze power controller data efficiently. Start with pandas for data manipulation and numpy for numerical operations. Use matplotlib to create visualizations that help you spot trends and anomalies. If you work with specialized power measurement hardware, consider QuarchPy, which provides direct integration with Quarch test equipment.
For advanced analytics or machine learning, libraries like TensorFlow and KERAS can help you build predictive models. OpenCV is useful if you plan to process images from cabinet sensors. On embedded platforms such as Raspberry Pi, you may also need libraries for sensor interfacing, like python-smbus or WiringPi.
Tip: Test your scripts and libraries on a PC before deploying them to embedded devices. This approach helps you catch compatibility issues early.
Installation Steps
Follow these steps to set up your Python environment for telecom data analysis, especially if you use a Raspberry Pi:
Connect your Raspberry Pi to the internet and attach necessary peripherals.
Open the terminal and update your system:
sudo apt-get update
sudo apt-get upgrade
Install essential build tools and Python dependencies:
sudo apt-get install build-essential python-dev python-smbus gitUse pip to install core libraries:
pip install pandas numpy matplotlib
pip install quarchpy
For machine learning or image processing, install additional libraries:
pip install KERAS
sudo pip install opencv-contrib-python
pip install "picamera[array]"
Clone sensor driver libraries if needed:
git clone https://github.com/DFRobotdl/37_Pcs_Sensor.gitOpen and test example scripts using an IDE like Thonny to verify sensor connections.
After successful setup, create a backup image of your SD card. This step saves your working environment and prevents data loss.
You may encounter challenges during installation. Compatibility issues between operating systems, Python versions, and library dependencies are common. Managing these dependencies and configuring environments across different devices can be tricky. Tools like Docker help you create consistent environments and reduce these problems.
Note: Always monitor your installation for errors and keep your libraries updated to maintain security and performance.
Data Collection and Prep
Importing Data
You start by importing data from your monitoring system. Most telecom power controllers let you export data in formats like CSV or through communication protocols such as DNP3. For example, the INCON Optimizer 3 system allows you to download reports via USB in CSV format. You can also connect to back-office software using the DNP3 protocol. CSV files work well with Python because you can load them directly into pandas DataFrames. DNP3 integration may require additional libraries or middleware, but it offers real-time data transfer.
To import a CSV file, use the following code:
import pandas as pd

data = pd.read_csv('power_data.csv')
print(data.head())
If you receive data from a remote server, you can use Python’s requests library to fetch files over HTTP or FTP. Always check the file encoding and delimiter to avoid import errors. You should also verify that the data matches the expected structure before moving to the next step.
Tip: Save raw data files in a dedicated folder. This practice helps you track changes and troubleshoot issues later.
Cleaning Data
After importing your data, you need to clean it. Cleaning ensures your analysis is accurate and reliable. Start by checking for missing values. Use pandas to identify and fill or remove these gaps:
# Check for missing values
print(data.isnull().sum())

# Fill missing values with zeros
data = data.fillna(0)
Next, look for duplicate rows. Remove them to prevent skewed results. You can use:
data = data.drop_duplicates()
Standardize column names for consistency. For example, change "Temp" to "Temperature" or "V" to "Voltage". This step makes your scripts easier to maintain. Also, convert data types if needed. For instance, make sure numeric columns are not stored as strings.
Note: Clean data leads to better trend detection and more accurate reports.
By following these steps, you prepare your data for automated analysis and visualization.
Automating Analysis with Python
Automating your data analysis workflow with Python transforms how you manage and maintain your Telecom Cabinet Power Controller systems. You can detect trends, spot anomalies, and generate reports with minimal manual effort. Python scripts help you process large volumes of data quickly and accurately, supporting proactive maintenance and operational efficiency.
Trend Detection
You can use Python to identify important trends in your power controller data. Start by collecting and preprocessing your data. Cleanse, normalize, and transform the readings to prepare for analysis. Feature engineering helps you select the most relevant metrics, such as current, voltage, temperature, and humidity.
Apply machine learning models to uncover patterns. Use supervised, unsupervised, or semi-supervised learning depending on your dataset. Techniques like principal component analysis reduce complexity and highlight key features. Models such as random forest and support vector machines work well for trend detection.
Visualize your results with tools like matplotlib or t-SNE. These visualizations make it easier to interpret trends and share insights with your team. You can automate these steps using Python scripts that run on a schedule or trigger based on new data arrivals.
Tip: Automating trend detection helps you spot gradual changes in power consumption, temperature, or humidity before they become problems.
Here are common trends you may identify in Telecom Cabinet Power Controller monitoring data:
Trend / Feature | Description and Impact |
|---|---|
AI-driven Predictive Maintenance | Uses AI models to analyze historical and environmental data, enabling early alerts, automated remediation, and optimized maintenance schedules, reducing downtime by up to 30% and extending hardware lifespan. |
Intelligent Power Monitoring | Deployment of advanced PDUs with sensors for real-time energy consumption tracking, anomaly detection, and remote management, improving hardware uptime by around 20% and reducing energy consumption by up to 21%. |
Integration of IoT and AI Technologies | Enables real-time data collection and predictive analytics, supporting dynamic load balancing and automated power allocation, which enhances operational efficiency and sustainability. |
Environmental Monitoring Sensors | Track temperature, humidity, airflow, and power consumption to prevent hardware failures, reduce downtime by up to 20%, and lower energy use by approximately 15%. |
Modular and Scalable Designs | Support evolving infrastructure needs, allowing easier maintenance and scalability while improving system resilience. |
Security Enhancements | Incorporate features like encryption, multi-factor authentication, biometric locks, and intrusion detection to protect critical telecom hardware from unauthorized access. |
Renewable Energy Integration | Use of passive cooling, solar power, and hybrid power systems to reduce grid dependency by up to 30%, lowering operational costs and environmental impact. |
Anomaly Detection
Python enables you to automate anomaly detection in your Telecom Cabinet Power Controller data. You can use models like isolation forest, which shows high precision and recall for detecting outliers. For time series data, an LSTM-based autoencoder built with Keras reconstructs input sequences and flags anomalies based on reconstruction error. This method works well for monitoring sensor readings over time.
Extract features such as RSSI, SNR, and Path Loss if your system supports wireless communication. Train supervised models with cross-validation and hyperparameter tuning to improve accuracy. Classify anomalies into categories like signal drift, multipath effect, or fuse failures. You can also use physics-based watchdog models to monitor execution times and performance counters, identifying deviations caused by faults or malware.
Here are frequent types of anomalies you may encounter:
Anomaly Type | Description/Characteristics | Assumed Causes and Notes |
|---|---|---|
Spiking Disturbances and Timeouts | Appear as salt-and-pepper noise and occasional complete timeouts in SNR spectra. Common even in nodes with good signal quality. | Causes unknown; possibly physical factors like signal reflection at joints or poorly shielded electronics. |
Periodic Disturbances | Show general periodicity, often daily, visible in SNR profiles. | Possibly caused by poorly shielded hardware, broken inverters, street lighting, or human activity. Exact cause often unconfirmed. |
Trends (e.g., Fuse Failures) | Significant breakdowns in SNR spectrum resembling fuse failures, sometimes simulated for study. | Cause linked to physical component failures. |
You can address class imbalance in your dataset using techniques like SMOTEENN. Evaluate your models with multiple metrics, such as precision, recall, and F1-score, to ensure balanced performance. Visualize anomalies to interpret results and take action quickly.
Note: Advanced AI techniques, including deep learning, GANs, and reinforcement learning, improve robustness and adaptivity in anomaly detection. Integrate these methods into your Python scripts for proactive fault management.
Report Automation
Automated reporting saves you time and ensures consistent documentation. Python scripts can generate customized reports from your Telecom Cabinet Power Controller data. You can use APIs to access real-time data from distributed cabinets, enabling remote monitoring and centralized analysis.
Integrate your scripts with platforms like ETAP or etapPy™ to run studies, generate output data, and create tailored Excel reports. These tools support remote execution and parallel processing, making batch reporting efficient. You can include device management, scenario data, and engineering properties in your reports.
Key components of an effective automated report include:
Multi-point temperature and humidity sensors for detailed environmental monitoring
Differential pressure sensors to monitor airflow and ventilation efficiency
Smoke and water leak sensors for early hazard detection
AI-driven analytics for predictive maintenance and dynamic thermal management
Centralized environment monitoring to consolidate sensor data and reduce alarm fatigue
Remote monitoring capabilities for real-time access and control
Automated alerts and controls to trigger backup power or maintenance actions
Power independence through backup systems ensuring continuous monitoring during outages
Integration with cloud and edge computing platforms for scalable data processing and reporting
Python scripts can export results in formats suitable for automated distribution, such as Excel, PDF, or cloud dashboards. You can schedule reports to run daily, weekly, or on demand, ensuring stakeholders receive timely updates.
Tip: Use RESTful APIs to connect your Python scripts with external tools and workflows. This approach supports interoperability and integration across your telecom infrastructure.
Here is a chart showing the impact of AI-driven analytics and predictive maintenance in telecom cabinet power controller monitoring:
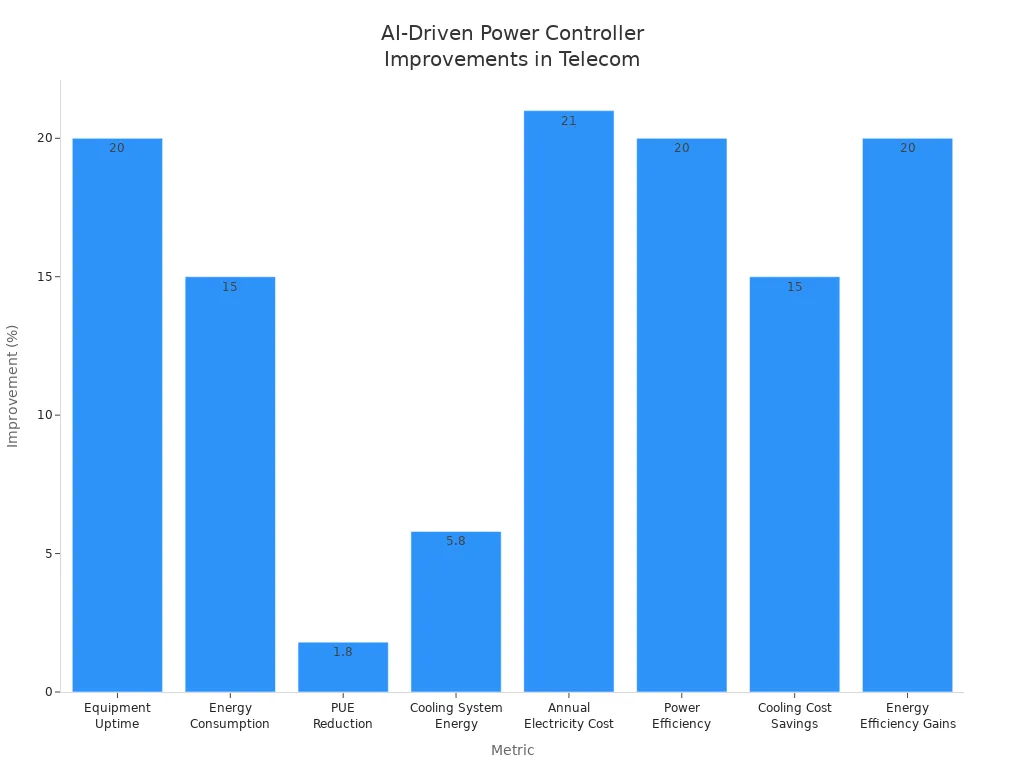
You can see significant improvements in equipment uptime, energy efficiency, and cost savings. AI-driven analytics and predictive maintenance help you manage your Telecom Cabinet Power Controller systems proactively, reducing downtime and optimizing performance.
Visualization and Reporting
Visualizing Results
You can turn raw data into clear insights by creating visualizations. Start by using Python libraries like matplotlib or seaborn. These tools help you plot trends, spot anomalies, and compare key metrics over time. For example, you can create a line chart to show voltage changes or a bar graph to compare energy consumption across different days.
To visualize your data, follow these steps:
Import your cleaned data into a pandas DataFrame.
Choose the metric you want to visualize, such as temperature or power.
Use matplotlib to create a simple plot.
Here is a sample code snippet:
import matplotlib.pyplot as plt

plt.plot(data['Timestamp'], data['Voltage'])
plt.xlabel('Time')
plt.ylabel('Voltage (V)')
plt.title('Voltage Trend Over Time')
plt.show()
You can also use scatter plots to highlight outliers or heatmaps to show correlations between variables. Visualizations make it easier to communicate findings to your team and support quick decision-making.
Tip: Save your plots as image files. This allows you to include them in reports or share them with others.
Sharing Reports
After you create your visualizations, you need to share your findings. Python makes it easy to automate report generation. You can export your results to Excel, PDF, or even cloud dashboards. Use pandas to write data to Excel files, or use libraries like ReportLab for PDFs.
Here are some ways to share your reports:
Email reports directly to stakeholders using Python’s smtplib library.
Upload reports to a shared cloud folder for easy access.
Schedule automatic report generation and delivery with task schedulers like cron or Windows Task Scheduler.
A simple example to export your analysis to Excel:
data.to_excel('analysis_report.xlsx', index=False)
Note: Always check that your reports include clear charts, key metrics, and actionable recommendations.
Sharing your results ensures everyone stays informed and can act quickly when issues arise.
Best Practices
Script Maintenance
You should keep your Python scripts organized and up to date. Start by using clear and descriptive names for your files and functions. Add comments to explain what each part of your code does. This helps you and your team understand the script when you return to it later.
Create a version control system using Git. This lets you track changes and roll back to earlier versions if something goes wrong. You can also use GitHub or GitLab to share your scripts with others. Test your scripts often. Write small test cases to check if your code works as expected. If you find bugs, fix them right away.
Tip: Schedule regular reviews of your scripts. Update them when you add new sensors or change data formats.
Keep a backup of your scripts and data. Store them in a secure location, such as a cloud drive or an external hard drive. This protects your work from accidental loss.
Optimization
You can make your scripts run faster and use less memory by following some simple steps. Use vectorized operations in pandas and numpy instead of loops. This speeds up data processing. Remove unnecessary code and functions that you no longer use.
Profile your scripts to find slow parts. Use Python’s built-in cProfile module to measure performance. Here is a quick example:
import cProfile
cProfile.run('your_function()')
Check your data size. If your files are large, process them in chunks. This prevents your computer from running out of memory. Use efficient data types, such as float32 instead of float64, when possible.
Optimization Tip | Benefit |
|---|---|
Vectorized operations | Faster data processing |
Chunked file reading | Lower memory usage |
Efficient data types | Smaller file sizes |
Remove unused code | Easier maintenance |
Note: Regular optimization keeps your scripts reliable and ready for new data challenges.
You can automate data analysis for your Telecom Cabinet Power Controller by following a clear workflow. Python scripts help you save time and improve accuracy. You gain deeper insights and reduce manual work. Try this approach in your own telecom operations to boost efficiency.
AI-driven analytics now predict failures and optimize maintenance.
Hybrid AC/DC systems support legacy and new hardware.
Software-defined controllers and real-time telemetry enable smarter energy management.
Operators use advanced platforms to meet energy mandates and cut costs.
Explore open architecture systems and advanced analytics to future-proof your monitoring strategy.
FAQ
How do you schedule Python scripts for automatic data analysis?
You can use the cron scheduler on Linux or Task Scheduler on Windows. Set your script to run at regular intervals. This ensures your data analysis happens automatically without manual intervention.
What should you do if your data import fails?
First, check your file path and format. Make sure your CSV or JSON file matches the expected structure. Use try-except blocks in Python to catch errors and print helpful messages for troubleshooting.
Can you run these scripts on embedded devices like Raspberry Pi?
Yes, you can. Install the required Python libraries on your Raspberry Pi. Test your scripts on a PC first. Then, transfer them to the device and verify sensor connections.
How do you handle missing or corrupted data?
Use pandas to identify missing values. Fill gaps with zeros or averages, or remove affected rows. For corrupted data, validate each entry before analysis. Clean data ensures accurate results.
What is the best way to share automated reports with your team?
Export your results to Excel or PDF. Email them using Python’s smtplib or upload to a shared cloud folder. Schedule report generation so your team always receives the latest insights.
CALL US DIRECTLY
86-13752765943
3A-8, SHUIWAN 1979 SQUARE (PHASE II), NO.111, TAIZI ROAD,SHUIWAN COMMUNITY, ZHAOSHANG STREET, NANSHAN DISTRICT, SHENZHEN, GUANGDONG, CHINA