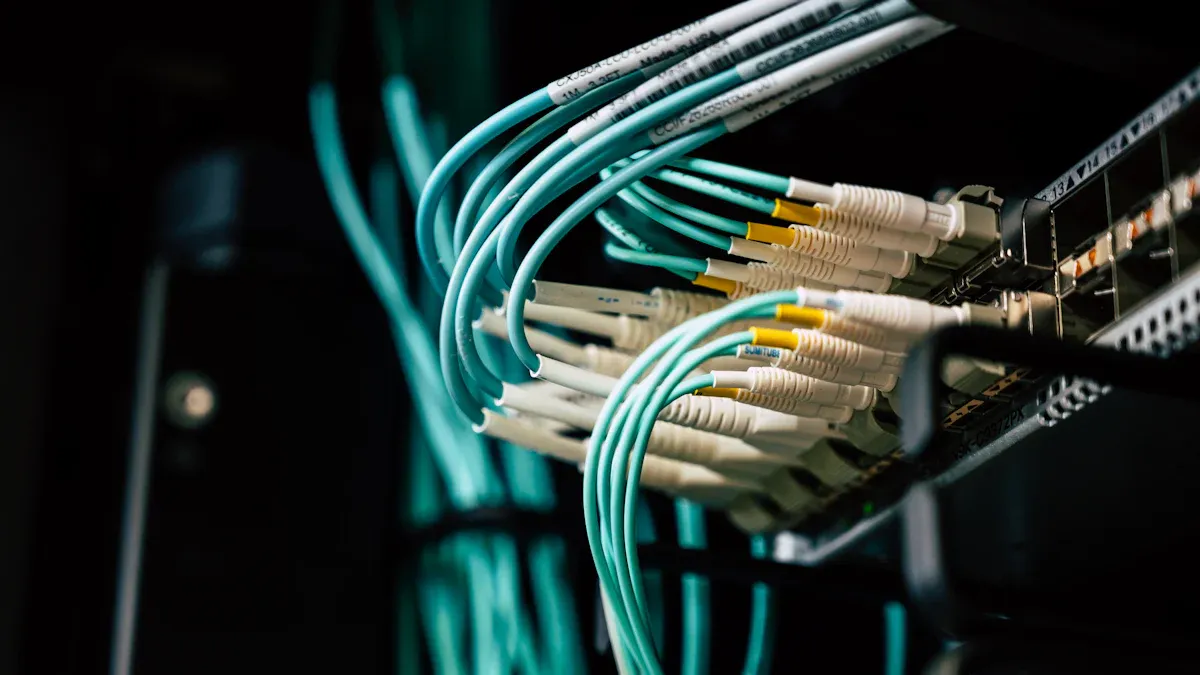
Carbon Footprint Calculation for Telecom Cabinet Power Systems: LCA Assessment from Raw Materials to End-of-Life

You can measure the environmental impact of Telecom Power Systems by calculating their carbon footprint through life cycle assessment (LCA). Accurate data helps you evaluate every stage, from raw materials to end-of-life. Consider both grid and diesel generator power sources, along with embodied emissions and Scope 3 impacts. The latest statistics show network-wide CO2 emissions dropped by up to 40%, with 5 million tons reduced in large networks. Annual energy savings per cabinet reach nearly 4,000 kWh, improving reliability and cutting operational costs.
Category | Statistic | Impact Description |
|---|---|---|
CO2 Emission Reduction | Up to 40% reduction network-wide; 5 million tons reduced in large networks | Substantial environmental impact supporting sustainability goals. |
Energy Savings | Nearly 4,000 kWh saved annually per cabinet (92% → 96% efficiency upgrade) | Reduces electricity consumption significantly, lowering operational costs. |
Operational Benefits | 20-30% energy savings reported; 20% network uptime improvement; 25-35% operational cost reduction | Enhances reliability, reduces downtime, and lowers total cost of ownership. |
Key Takeaways
Measuring the carbon footprint of Telecom Power Systems helps identify emission hotspots and improve sustainability efforts.
Switching to renewable energy sources, like solar, can significantly reduce operational emissions and lower costs.
Implementing energy-efficient practices can lead to substantial savings, enhancing reliability and reducing downtime.
Using Life Cycle Assessment (LCA) provides a comprehensive view of emissions from raw materials to end-of-life, guiding better decision-making.
Regular maintenance and upgrades can extend the life of equipment, reduce emissions, and lower long-term operational costs.
Why Carbon Footprint Matters
Sustainability Goals
You play a key role in shaping a sustainable future when you focus on reducing the carbon footprint of Telecom Power Systems. Many companies align their efforts with global sustainability goals, such as the United Nations Sustainable Development Goals (SDGs). The table below shows how telecom infrastructure supports these goals:
SDG Number | SDG Goal Description | Relevance to Telecom Infrastructure |
|---|---|---|
9 | Industry Innovation and Infrastructure | Telecom networks enable inclusive and sustainable industrialization. |
13 | Climate Action | Telecom companies are adopting sustainable practices to reduce emissions. |
Telecom companies also support the ITU’s Connect 2030 Agenda, which highlights universal connectivity and sustainable digital transformation. By reducing emissions, you help your organization contribute to these global objectives.
Regulatory Drivers
You must meet strict regulations that aim to lower greenhouse gas emissions. Governments and industry bodies set standards for energy efficiency and carbon reporting. These rules push you to adopt cleaner technologies and improve operational practices. Solar energy systems offer a practical solution because they generate electricity without releasing harmful gases. Solar panels produce electricity with zero direct greenhouse gas emissions. Life-cycle emissions from solar electricity are about 12 times lower than natural gas and 20 times lower than coal. By choosing renewable energy sources, you can comply with regulations and reduce your environmental impact.
Business Benefits
Reducing the carbon footprint of Telecom Power Systems brings several advantages to your business.
You ensure reliable backup power and reduce downtime, even in remote areas.
You lower operational costs by cutting fuel use and maintenance needs.
You support sustainability by reducing carbon emissions and reliance on fossil fuels.
When you invest in energy-efficient solutions, you improve network uptime and reduce total cost of ownership. These benefits make your business more competitive and resilient in a changing market.
LCA for Telecom Power Systems

LCA Overview
You can use Life Cycle Assessment (LCA) to measure the environmental impact of Telecom Power Systems. LCA gives you a complete view by tracking emissions from the start of a product’s life to its end. This approach helps you understand where most emissions come from and where you can make improvements. You look at every stage, from raw material extraction to disposal or recycling. LCA uses a functional unit, such as “one telecom cabinet operating for 10 years,” to keep results consistent and comparable.
You need to consider all sources of emissions. These include direct emissions from electricity use and indirect emissions from manufacturing and transport. You also need to include Scope 3 emissions, which cover activities outside your direct control, like the production of raw materials. By using LCA, you can identify emission hotspots and make informed decisions to reduce your carbon footprint.
System Boundaries
Setting clear system boundaries is a key step in LCA. You decide which processes and activities to include in your assessment. For Telecom Power Systems, you should cover the entire life cycle:
Raw material extraction and processing
Manufacturing of components and assembly
Transportation to the installation site
Installation and commissioning
Operation, including both grid and diesel generator power sources
Maintenance and repairs
End-of-life treatment, such as recycling or disposal
Tip: Always include both grid electricity and diesel generator use in your boundaries. These two sources can have very different emission factors and can change the results of your assessment.
You should also include embodied emissions, which are the emissions locked into the materials and products before they reach you. Scope 3 emissions, such as those from suppliers or waste management, are important for a full picture.
Life Cycle Stages
Each stage in the life cycle of Telecom Power Systems contributes to the total carbon footprint. Some stages have a much bigger impact than others. According to published research, operation and maintenance create the largest share of emissions. Equipment production also plays a significant role, while installation and construction have a smaller effect.
Here is a summary of carbon emissions by life cycle stage:
Life Cycle Stage | Total Carbon Emissions (t CO2 eq) |
|---|---|
Operation and Maintenance | 12,900 |
Equipment Production | 6,520 |
Installation and Construction | 395 |
You can see that operation and maintenance account for the majority of emissions. This stage includes the electricity used by the cabinet, whether from the grid or diesel generators. Equipment production comes next, which covers the manufacturing of all parts and materials. Installation and construction have a much smaller impact, but you should still include them for a complete assessment.
When you assess Telecom Power Systems, always pay close attention to the operation phase. This is where you can achieve the biggest reductions, especially by improving energy efficiency or switching to renewable power sources. You should also look for ways to lower emissions during manufacturing and consider end-of-life options like recycling to further reduce your impact.
Emission Sources

Raw Materials
You start by looking at the raw materials used in Telecom Power Systems. Metals like steel, copper, and aluminum require mining and processing. These activities release greenhouse gases. The choice of materials and their sources can change the total emissions. Using recycled metals often lowers the carbon footprint.
Manufacturing
Manufacturing turns raw materials into finished components. Factories use electricity and fuel to shape, assemble, and test parts. The energy mix at the factory—whether it relies on coal, gas, or renewables—affects the emissions. Efficient manufacturing processes and local sourcing help reduce this impact.
Transport
Moving Telecom Power Systems from the factory to the installation site creates emissions. Heavy diesel trucks usually handle this job. You can estimate the carbon footprint using the following formula:
Parameter | Description |
|---|---|
Q_i | Weight of equipment (kg) |
L_i | Distance transported (km) |
F_i | Carbon emission factor (kg CO₂/t·km) |
Formula:
E_t2 = ∑ Q_i × L_i × F_i
Longer distances and heavier loads increase emissions. Choosing efficient routes and cleaner vehicles can help lower the transport footprint.
Installation
Installation includes setting up the cabinet, wiring, and connecting to power sources. This stage uses tools and sometimes temporary generators. The emissions here are usually small compared to other stages, but you should still track them for a complete assessment.
Operation (Grid, DG Set, PTE)
Operation is the largest source of emissions. Cabinets draw power from the grid or diesel generators (DG sets). Grid electricity emissions depend on the local energy mix. Diesel generators release more CO₂ per unit of energy. Power transmission efficiency (PTE) also matters. Improving efficiency and using renewable energy can cut emissions during this stage.
Maintenance
Regular maintenance keeps systems running smoothly. Preventive maintenance improves efficiency and extends the life of Telecom Power Systems. This reduces energy use and emissions over time. You benefit from fewer breakdowns and lower long-term costs.
End-of-Life
At the end of service, you must decide how to handle old equipment. Recycling metals and components reduces waste and recovers valuable materials. Proper disposal prevents harmful substances from entering the environment. Planning for recycling at the design stage can further lower the carbon footprint.
Data and Tools
Data Requirements
You need accurate and comprehensive data to calculate the carbon footprint of Telecom Power Systems. Start by collecting information on energy consumption. This includes the amount of electricity used during operation, both from the grid and diesel generators. Reliable electricity consumption data helps you pinpoint emission hotspots and track improvements over time.
You should also gather these data types:
Emission factors for grid electricity and diesel fuel
Power transmission efficiency (PTE) values
Material composition and weight of each component
Manufacturing energy use and process details
Transport distances and modes
Maintenance schedules and activities
End-of-life treatment methods, such as recycling rates
Tip: Always verify your electricity consumption data. Small errors can lead to large mistakes in your final carbon footprint calculation.
LCA Tools
You can use several tools to perform life cycle assessments for Telecom Power Systems. These tools help you organize data, apply emission factors, and generate clear reports.
TECHTEST Tool: This spreadsheet tool combines life cycle assessment and technoeconomic analysis. It estimates energy and cost impacts for new technologies.
Ecochain Mobius: Designed for business users, this tool offers a user-friendly interface.
Ecochain Helix: Integrates comprehensive data for detailed analysis.
SimaPro: Known for its extensive database and industry recognition.
GaBi: Strong in industrial applications, suitable for complex assessments.
oneClickLCA: Cloud-based tool for quick assessments.
openLCA: Open-source and highly customizable.
Here is a comparison of popular LCA tools:
LCA Tool | Strengths | Limitations |
|---|---|---|
Ecochain Mobius | User-friendly interface, tailored for businesses | Limited advanced features compared to others |
Ecochain Helix | Comprehensive data integration | Higher cost for small businesses |
SimaPro | Extensive database, widely recognized | Steeper learning curve |
GaBi | Strong in industrial applications | Can be complex for new users |
oneClickLCA | Quick assessments, cloud-based | May lack depth in certain analyses |
openLCA | Open-source, customizable | Requires technical knowledge for setup |
Note: Choose a tool that matches your technical skills and project needs. Some tools offer quick results, while others provide deeper analysis but require more expertise.
Assessment Steps
Data Collection
You begin your carbon footprint assessment by gathering accurate and relevant data. Start with energy consumption records for each cabinet, including both grid and diesel generator usage. Collect information on the materials used, such as the weight and type of metals, plastics, and electronic components. Record manufacturing energy use, transport distances, and the modes of transportation. Maintenance logs and end-of-life treatment plans also provide essential details.
Tip: Use digital monitoring tools and smart meters to track real-time energy use. This approach helps you avoid estimation errors and ensures data reliability.
Create a checklist to organize your data collection process:
Energy consumption (grid and diesel generator)
Emission factors for electricity and fuel
Material composition and weights
Manufacturing energy and process details
Transport distances and vehicle types
Maintenance frequency and activities
End-of-life recycling or disposal methods
Accurate data forms the foundation of a credible assessment. Incomplete or incorrect data can lead to misleading results.
Calculation
Once you have collected your data, you move to the calculation phase. Use emission factors to convert energy use and material quantities into carbon emissions. Most LCA tools allow you to input your data and automatically apply the correct emission factors.
A typical calculation for transport emissions looks like this:
Transport Emissions (kg CO₂) = Equipment Weight (kg) × Distance (km) × Emission Factor (kg CO₂/t·km)
For operational emissions, multiply the electricity consumed by the emission factor for your local grid or diesel fuel. Add up emissions from each life cycle stage to get the total carbon footprint.
Note: Double-check your calculations for each stage. Small mistakes can add up and affect your final results.
Results Interpretation
After calculating the total emissions, you interpret the results to identify emission hotspots. Review the breakdown by life cycle stage. You often find that operation and maintenance contribute the most to the overall footprint. Manufacturing and transport may also play significant roles, depending on your supply chain and equipment choices.
Use visual aids like pie charts or bar graphs to present your findings. This makes it easier to communicate results to stakeholders and prioritize areas for improvement.
Ask yourself these questions:
Which stage generates the most emissions?
Are there unexpected hotspots?
How do your results compare to industry benchmarks?
Understanding these patterns helps you target your reduction efforts where they will have the greatest impact.
Reduction Strategies
You can implement several proven strategies to reduce the carbon footprint of your telecom infrastructure. The following table summarizes effective approaches:
Strategy | Description | Benefits |
|---|---|---|
Clean Energy | Switch to renewable sources like solar and wind. | Cuts Scope 2 emissions by up to 20%. |
Energy Efficiency | Upgrade equipment and optimize operations. | Achieves up to 30% energy cost savings and supports decarbonization. |
Network Sharing | Share infrastructure with other operators. | Reduces total emissions by up to 10% and material use by over 30%. |
Renewable Integration | Combine solar panels and wind turbines in power systems. | Lowers carbon footprint, cuts costs, and improves reliability. |
You can also integrate renewable sources directly into your power systems:
Integration Method | Benefit | |
|---|---|---|
Solar | Photovoltaic panels, MPPT | Lower emissions |
Wind | Micro-turbines, inverters | Cost savings |
Hybrid | Combined systems | Enhanced reliability |
Many telecom operators have already achieved impressive results. Swisscom operates its network entirely on renewable energy. Vivo Brazil uses solar and biogas to supply 20% of its electricity. Orange has adopted free-cooling technology, reducing air conditioning needs by 80%.
You can further accelerate your transition to renewables through power purchase agreements (PPAs). These long-term contracts offer several advantages:
Feature | Description |
|---|---|
Contract Length | 10-20 years, ensuring stable energy procurement. |
Price Stability | Fixed pricing for renewables, supporting predictable budgeting. |
Emission Reduction Credit | Credits for replacing fossil fuels, significantly lowering Scope 2 emissions. |
Flexibility | Customizable contracts for different energy sources and needs. |
PPAs assure renewable project developers of a market for their energy.
They provide stable, fixed prices, making renewables competitive with fossil fuels.
Falling PPA prices make it easier for telecom operators to switch to clean energy.
Efficiency improvements also play a key role. Artificial intelligence (AI) can optimize energy use by monitoring systems in real time, balancing loads, and predicting faults. AI helps you integrate renewables, manage energy storage, and extend battery life. Advanced batteries maintain service during peak demand and grid instability, while AI-driven management reduces waste and improves reliability.
Tip: Combine multiple strategies for the best results. For example, use AI to optimize both renewable integration and energy storage.
By following these steps and adopting proven strategies, you can significantly reduce the carbon footprint of Telecom Power Systems and support your organization’s sustainability goals.
You can calculate the carbon footprint of telecom cabinet power systems by following a clear LCA process. Gather accurate data, apply emission factors, and assess every life cycle stage. Hybrid systems, especially those combining diesel gensets with renewables, have cut fuel use by over 79% in Indonesia and reduced costs by 47% in Malaysia. You can improve your reporting by:
Using streamlined embodied methodologies for separate emission tracking.
Adopting scalable methods for better GHG values.
Aligning with industry metrics for transparency.
Explore these resources to deepen your sustainability efforts:
Resource Description | Key Benefits |
|---|---|
Solar energy solutions | Scalable, practical, and reduces environmental impact |
Modular solar plants and hybrid systems | Adaptable and reliable as energy needs grow |
ESTEL’s renewable energy solutions | Optimizes energy use and lowers footprint |
FAQ
What is the main source of carbon emissions in telecom cabinet power systems?
Operation usually creates the most emissions. Electricity use from the grid or diesel generators drives this. You can lower these emissions by using renewable energy and improving energy efficiency.
How do you choose the right LCA tool for your project?
You should match the tool to your technical skills and project needs. Some tools offer quick results with simple interfaces. Others provide deeper analysis but require more expertise. Always check if the tool supports telecom-specific data.
Why is accurate electricity consumption data important?
Accurate data helps you find emission hotspots and track progress. Small errors in electricity use can lead to large mistakes in your carbon footprint calculation. You should use digital meters for the best results.
Can you reduce emissions without replacing all equipment?
Yes, you can. Upgrade key components, improve maintenance, and use renewable energy. These steps lower emissions and save costs. You do not need to replace every part to see benefits.
See Also
Methods For Calculating Power Systems And Telecom Batteries
A Complete Overview Of Telecom Cabinet Battery Risk Analysis
Solar Energy Storage Solutions For Telecom Cabinet Systems
CALL US DIRECTLY
86-13752765943
3A-8, SHUIWAN 1979 SQUARE (PHASE II), NO.111, TAIZI ROAD,SHUIWAN COMMUNITY, ZHAOSHANG STREET, NANSHAN DISTRICT, SHENZHEN, GUANGDONG, CHINA

