Equipment Health Assessment System of Smart Power Distribution Units: Quantitative Scoring from Electrical Parameters to Aging Degree

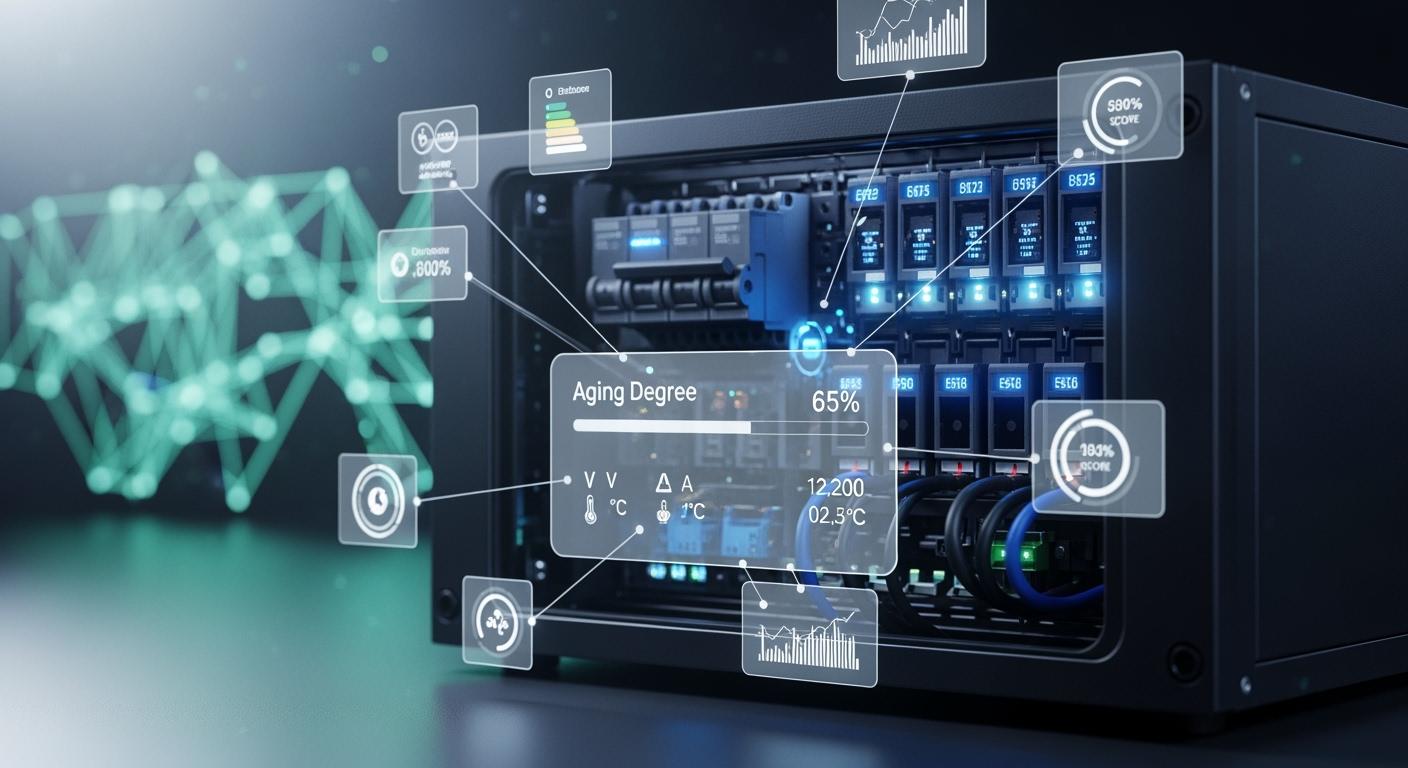
You gain a clear understanding of your equipment’s health with ESTEL’s Smart Power Distribution Unit. Real-time monitoring of electrical parameters, such as voltage and current, allows you to detect potential faults before they disrupt your system. This approach gives you a quantitative health score, which maps directly to the aging degree of your equipment. You save on maintenance costs and boost system reliability by identifying issues early and acting proactively.
Key Takeaways
Monitor electrical parameters like voltage and current in real time to catch potential faults early. This proactive approach helps prevent system failures.
Use the health score generated by the Smart Power Distribution Unit to assess equipment aging. Higher scores indicate better health, guiding maintenance decisions.
Implement predictive maintenance strategies based on health scores to reduce costs and downtime. This method allows for repairs only when necessary, saving resources.
Customize health score thresholds to fit your operational needs. Tailoring these settings enhances your maintenance strategy and risk management.
Leverage advanced features like remote management and environmental monitoring to maintain optimal conditions and improve overall system reliability.
Equipment Health Assessment in Smart Power Distribution Units
System Overview and Purpose
You rely on your equipment to deliver consistent performance. The Smart Power Distribution Unit gives you a clear view of your system’s health by tracking electrical parameters in real time. This system helps you spot problems early, so you can prevent downtime and protect your investment. You gain access to a health score that reflects the current state of your equipment. This score makes it easy to understand how close your devices are to their aging threshold.
Smart Power Distribution Units stand apart from traditional units in several ways:
You monitor every outlet in real time, which lets you see power usage and detect issues before they become serious.
You manage devices remotely, while traditional units only provide basic power distribution.
You benefit from advanced features like alarm functions and environmental monitoring, which support proactive management.
These capabilities help you maintain a reliable power infrastructure and make informed decisions about maintenance.
ESTEL’s Approach to Health Assessment
ESTEL takes health assessment to the next level. You use a Smart Power Distribution Unit that combines real-time monitoring, remote management, and customizable solutions. The system offers outlet-level metering and switching, so you control power delivery with precision. You save energy and reduce costs, thanks to up to 30% efficiency improvements. Safety certifications like UL Listed, CE Mark, and IEC compliance give you peace of mind.
Feature | ESTEL PDUs | Other Smart PDUs |
|---|---|---|
Real-time power monitoring | Yes | Varies |
Remote management | Yes | Limited |
Customizable solutions | Yes | Often fixed configurations |
Up to 30% savings | Varies | |
Modular design | Yes | Limited flexibility |
Safety certifications | UL Listed, CE Mark, IEC compliant | Varies |
Outlet-level metering | Yes | Limited |
Outlet-level switching | Yes | Limited |
You choose ESTEL’s Smart Power Distribution Unit to gain advanced health assessment features and flexible power management. This approach ensures your telecom and data center equipment stays healthy and operates efficiently.
Key Electrical Parameters and Monitoring
Voltage, Current, and Load
You need to monitor voltage, current, and load to keep your power system healthy. These parameters show how much electricity your equipment uses and if it operates within safe limits. Continuous monitoring gives you real-time data, which helps you spot problems before they cause failures. In telecom and data center environments, you rely on this data to maintain operational efficiency.
You should pay attention to these critical aspects:
Power quality: Check for balanced phases and avoid excessive neutral current. This prevents energy waste.
Power factor: Watch for low power factor, as it signals inefficiency and can lead to extra costs.
Capacity management: Analyze load trends to prevent overloads and ensure efficient power distribution.
You can use the following table to understand common threshold values for voltage:
Parameter | Threshold Value |
|---|---|
Voltage sag threshold | Below 90% of nominal |
Voltage swell threshold | Above 110% of nominal |
SEMI F47 voltage sag immunity | 50% voltage for up to 200ms |
70% voltage for up to 500ms | |
80% voltage for up to 1 second |
If you see values outside these ranges, your equipment may face stress or damage. The Smart Power Distribution Unit helps you track these numbers and respond quickly.
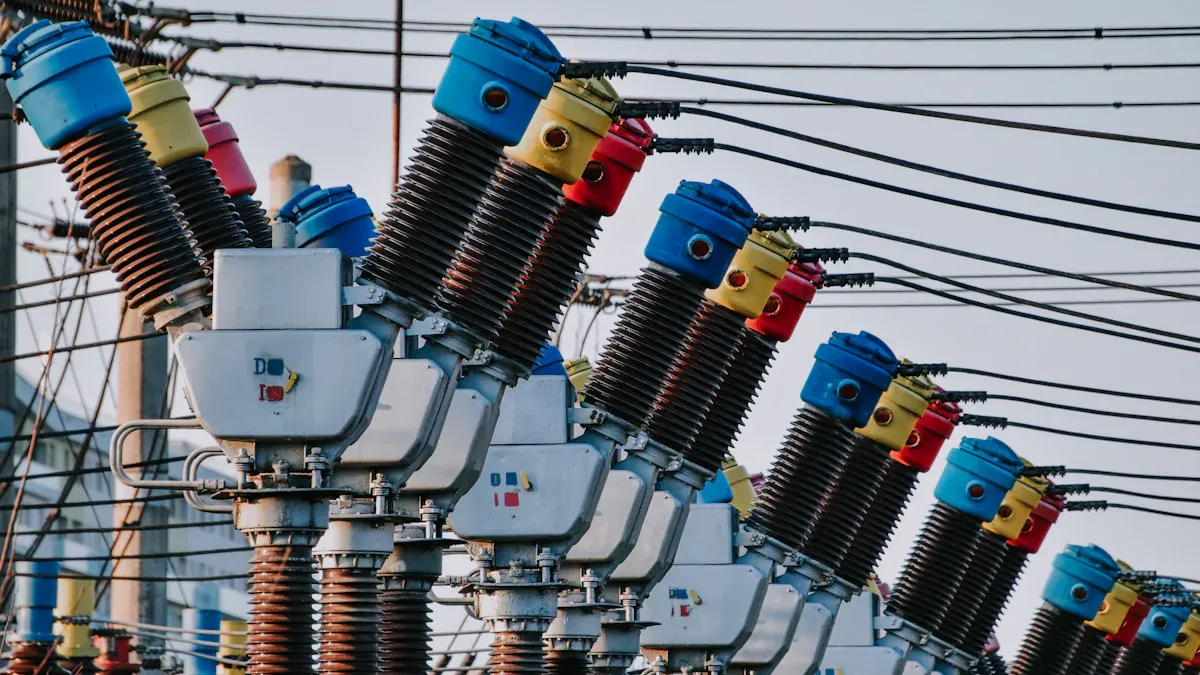
Temperature and Insulation Resistance
You must also monitor temperature and insulation resistance. High temperatures can speed up the aging of your equipment. The hottest points, called hot spots, are especially important. If the temperature rises just 6°C above the rated level, the insulation can age twice as fast. This weakens your equipment and increases the risk of electrical breakdown.
Sustained high temperatures can also cause oil inside transformers to break down. This process produces gases that signal thermal faults. By watching for abnormal temperature changes, you can catch early signs of aging and prevent failures.
Insulation resistance tells you how well your equipment resists electrical leakage. Low resistance means your system is at risk for short circuits or breakdowns. Regular checks help you keep your power system safe and reliable.
Data Collection and Processing Methods
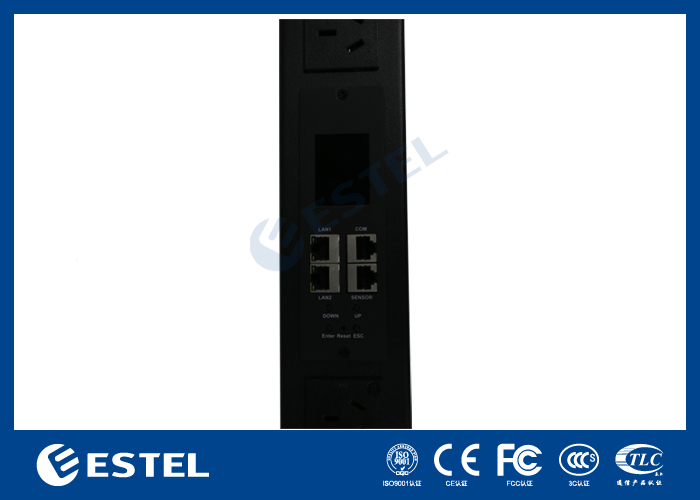
Sensor Integration in ESTEL Smart PDUs
You depend on accurate data to keep your equipment running smoothly. ESTEL integrates several sensors into each unit to monitor key electrical and environmental parameters. These sensors collect real-time information, which helps you track the health of your system. You can see the types of sensors and their functions in the table below:
Sensor Type | Function |
|---|---|
Voltage Sensor | Monitors voltage levels in real time. |
Current Sensor | Monitors current levels in real time. |
Temperature Sensor | Monitors temperature levels in real time. |
Environmental Sensor | Monitors environmental conditions. |
You use voltage and current sensors to check if your equipment operates within safe limits. Temperature sensors alert you when heat levels rise, which signals possible aging or faults. Environmental sensors detect changes in humidity or air quality, helping you maintain optimal conditions.
Data Transmission and Preprocessing
You receive data from these sensors through secure transmission channels. The Smart Power Distribution Unit sends information to a central monitoring system. You access this data remotely, which allows you to respond quickly to any issues.
Before you analyze the data, the system preprocesses it. This step removes noise and filters out irrelevant readings. You get clean, reliable information that supports accurate health assessments. The unit uses intelligent algorithms to organize and summarize the data. You see trends and patterns that help you make informed decisions about maintenance and equipment replacement.
Tip: You can set alerts for abnormal readings. This feature lets you act fast and prevent downtime.
You rely on these methods to keep your power infrastructure safe and efficient.
Quantitative Scoring and Health Index
Scoring Models and Algorithms
You use quantitative scoring models to turn electrical data into clear health scores. These models help you understand the condition of your equipment and make decisions based on facts. You see several types of scoring models in the industry. Each model uses a different approach to handle complex data and uncertainty.
Fuzzy comprehensive assessment lets you deal with uncertain or incomplete information. You get a score that reflects real-world conditions.
Combined weighting model uses multiple factors and assigns importance to each. You see a balanced health score.
Neural network model learns from historical data. You get predictions about equipment health based on patterns.
Bayesian network model helps you reason with uncertain data. You see how different factors affect the health score.
You also find other methods that support health assessment. The table below shows some popular models and their descriptions:
Model Type | Description |
|---|---|
Hybrid Information-Based Method | Utilizes both quantitative data and qualitative knowledge for a balanced evaluation of equipment health. |
Fuzzy Rule | Incorporates fuzzy logic to handle uncertainty in health assessments. |
Analytic Hierarchy Process (AHP) | Organizes and analyzes complex decisions using mathematics and psychology. |
Evidence Theory | Provides a framework for reasoning with uncertain information. |
Belief Rule Base | Combines rules and beliefs to assess health states effectively. |
You select a model based on your needs and the complexity of your system. You rely on these models to turn sensor readings from your Smart Power Distribution Unit into actionable health scores.
Tip: You can improve accuracy by combining several models. This approach gives you a more reliable health index.
Mapping Scores to Aging Degree
You use the health score to estimate the aging degree of your equipment. The score ranges from 0 to 100. Higher scores mean your equipment is healthy. Lower scores signal aging or potential faults.
You follow a simple mapping process:
Collect real-time data from sensors.
Process the data using your chosen scoring model.
Generate a health score.
Compare the score to aging thresholds.
You see the mapping in action with the following example:
Health Score | Aging Degree | Recommended Action |
|---|---|---|
90-100 | New or Excellent | Routine monitoring |
70-89 | Slightly Aged | Schedule preventive checks |
50-69 | Moderately Aged | Plan maintenance soon |
30-49 | Heavily Aged | Immediate maintenance |
0-29 | Critical | Replace equipment |
You use this mapping to decide when to perform maintenance or replace equipment. You avoid unexpected failures and extend the life of your power system. You rely on the Smart Power Distribution Unit to provide accurate scores and support your decisions.
Note: You can set custom thresholds based on your environment and risk tolerance.
You gain confidence in your maintenance strategy. You keep your telecom and data center equipment running smoothly by using quantitative scoring and health index mapping.
Practical Application and Maintenance Decisions
Real-World Use with ESTEL Smart Power Distribution Unit
You can see the impact of health assessment in action through real-world deployments. Telecom and data center operators have used ESTEL Smart Power Distribution Unit to improve reliability and reduce costs. Operators in Africa reported a 40% reduction in energy expenses. In India, companies achieved uninterrupted connectivity in rural areas and lowered carbon emissions. European operators saw a 30% decrease in their carbon footprint. MTN South Sudan reduced fuel costs by 30%. These results show how you can use advanced monitoring to drive operational improvements.
Region | Operator/Project | Benefit Description | Metric/Outcome |
|---|---|---|---|
Africa | Leading telecom provider | Reduced operational costs, improved reliability | 40% reduction in energy expenses |
India | Various operators | Addressed rural energy challenges | Uninterrupted connectivity, reduced emissions |
Europe | European operator | Lowered carbon footprint | 30% reduction in carbon emissions |
Southeast Asia | Telecom company | Improved network reliability in off-grid areas | N/A |
South Sudan | MTN South Sudan | Reduced fuel costs | 30% reduction in fuel costs |
Operators have also highlighted energy savings of up to 41% and enhanced network reliability. You benefit from real-time monitoring, overload protection, and remote management. These features help you maintain optimal conditions and respond quickly to issues.
Maintenance and Replacement Strategies
You use health scores to guide your maintenance and replacement decisions. When the system detects a drop in the health index, you can schedule preventive checks or plan immediate repairs. This approach supports predictive maintenance, which relies on real-time data instead of fixed schedules.
You can compare maintenance strategies using the table below:
Factor | Preventive Maintenance | Predictive Maintenance |
|---|---|---|
Cost of Inspections | Recurring, regardless of need | Condition-based, fewer over time |
Repair Costs | Moderate, can include unneeded repairs | Lower, due to early detection |
Unplanned Downtime | Still occurs between intervals | Significantly reduced |
Labor & Overtime | Often required for shutdowns | Reduced through advanced scheduling |
Part Replacements | Based on age, not wear | Based on actual degradation |
ROI | Neutral to moderate | High, often achieved within months |
You can avoid unnecessary costs and reduce unplanned downtime. Research shows that predictive maintenance delivers 8-12% cost savings over preventive approaches. You also improve risk assessment by using an AI-driven risk matrix, which helps you identify future risks and optimize your maintenance strategy.
Tip: You can set custom thresholds for health scores to match your risk tolerance and operational needs.
You gain greater control over your power infrastructure and ensure long-term reliability for your telecom or data center environment.
You gain accurate insights into equipment health and aging with ESTEL’s Smart Power Distribution Unit. Real-time scoring from electrical parameters helps you make informed decisions. You see improved reliability and operational efficiency. Networks that switched to ESTEL reported maintenance costs dropping to 7% of previous levels and repair times decreasing from 4.8 to 3.1 hours.
Benefit | Description |
|---|---|
Reduced Downtime | Predictive maintenance prevents unexpected outages. |
Lower Maintenance Costs | Early detection means fewer emergency service calls. |
Improved Energy Management | Real-time tracking reduces wasted power and saves money. |
You can rely on ESTEL for advanced power distribution and equipment health management.
FAQ
How does the Smart Power Distribution Unit help you reduce downtime?
You monitor real-time electrical parameters. The unit alerts you to abnormal readings. You act quickly to fix issues. This process prevents unexpected outages and keeps your system running smoothly.
Can you customize health score thresholds for your environment?
Yes, you set custom thresholds based on your risk tolerance and operational needs. This flexibility lets you tailor maintenance schedules and replacement strategies to fit your specific requirements.
What electrical parameters does the unit track?
You track voltage, current, load, temperature, and insulation resistance. These parameters give you a complete view of your equipment’s health and aging degree.
Is remote monitoring available with ESTEL Smart PDUs?
You access remote monitoring features. The unit sends real-time data to your central system. You manage power distribution and respond to alerts from anywhere.
What maintenance strategy works best with health scoring?
Predictive maintenance works best. You use health scores to schedule checks and repairs only when needed. This approach saves money and reduces downtime.
See Also
A Complete Overview of Telecom Cabinet Battery Risk Analysis
Methods for Calculating Telecom Cabinet Power Systems and Batteries
Exploring Global Standards for Communication Power Supply Systems
Solar Energy Storage Solutions for Telecom Cabinet Power Systems
CALL US DIRECTLY
86-13752765943
3A-8, SHUIWAN 1979 SQUARE (PHASE II), NO.111, TAIZI ROAD,SHUIWAN COMMUNITY, ZHAOSHANG STREET, NANSHAN DISTRICT, SHENZHEN, GUANGDONG, CHINA