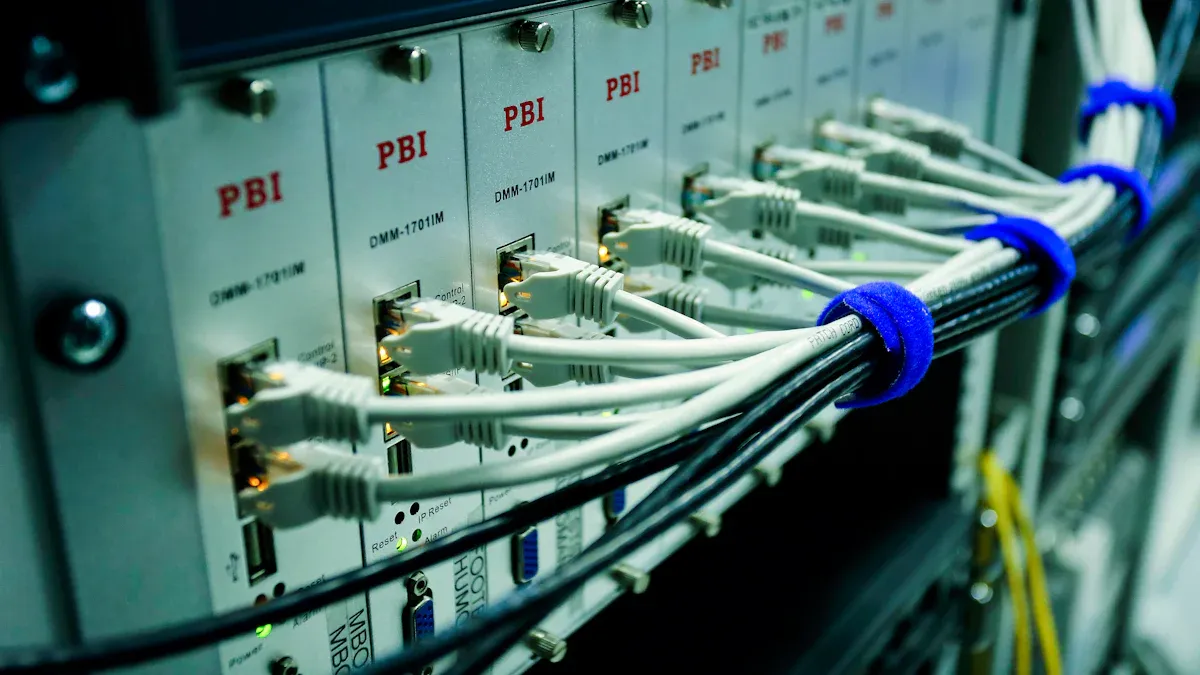
Telecom Cabinet Power Controller Monitoring Interface Design: 3 Key Elements of Visual Charts (Voltage Trend/Load Heatmap)

To monitor a Telecom Cabinet Power Controller effectively, you should focus on three essential visual charts:
Voltage Trend
Load Heatmap
Alarm/Event Timeline
These charts help you track system health, spot unusual patterns, and respond quickly to issues. You gain real-time visibility and centralized control, which supports smarter and faster decisions.
Key Takeaways
Use voltage trend charts to monitor power levels and spot problems early, helping prevent equipment failures.
Load heatmaps show temperature and power distribution inside the cabinet, allowing quick detection of hotspots and inefficiencies.
Alarm/event timelines track critical incidents in order, helping you understand issues and plan maintenance effectively.
Combine all charts in a clear dashboard for fast access to important data and easier decision-making.
Follow industry standards to ensure your monitoring system is safe, compatible, and ready for future upgrades.
Voltage Trend

Telecom Cabinet Power Controller Trends
You need to track voltage levels in your Telecom Cabinet Power Controller to keep your equipment safe and reliable. Voltage trend charts show you both real-time and historical voltage data. These charts help you spot sudden drops, spikes, or gradual changes in voltage. When you see these trends, you can understand how your power system behaves over time. You can also compare voltage patterns during different periods, such as peak hours and off-peak times. This information helps you prevent equipment failures and plan for maintenance.
Tip: Use voltage trend charts to catch problems early. If you notice a steady decline or frequent spikes, you can act before the issue becomes critical.
Chart Design
A clear and effective voltage trend chart makes your monitoring easier. You should choose a time interval that matches your needs. For example, use a one-minute interval for real-time monitoring or a one-hour interval for long-term analysis. Mark important voltage thresholds on the chart. These thresholds show you safe, warning, and danger zones. You can use different colors for each zone to make them easy to spot.
Add alert integration to your chart. When the voltage crosses a threshold, the chart should highlight the event. You can use icons, color changes, or pop-up messages. This feature helps you notice problems right away. Interactive features, such as zooming and tooltips, let you explore the data in detail. You can focus on specific time periods or voltage events.
Chart Feature | Benefit |
|---|---|
Time Intervals | Match monitoring needs |
Threshold Markers | Show safe and danger zones |
Alert Integration | Highlight critical events |
Interactivity | Explore data in detail |
User Actions
When you see voltage anomalies in your Telecom Cabinet Power Controller, you need to act fast. The chart gives you actionable insights. If you spot a sudden voltage drop, you can check for equipment overloads or power supply issues. If you see frequent spikes, you might need to inspect your wiring or grounding. Use the chart to document these events and share them with your maintenance team.
You can also set up automated alerts based on the chart data. When the voltage goes outside the safe range, you receive a notification. This feature helps you respond quickly, even if you are not watching the chart all the time. By using voltage trend charts, you improve your system’s reliability and reduce downtime.
Load Heatmap

Power Controller Load Heatmap
A load heatmap gives you a clear picture of how power and environmental factors distribute inside your telecom cabinet. You can see temperature, humidity, airflow, and power usage all in one place. Sensors inside the cabinet collect this data in real time. The heatmap then turns these numbers into colors and patterns. You can spot areas with high temperatures or uneven power loads at a glance. This helps you keep your Telecom Cabinet Power Controller running safely and efficiently.
A well-designed load heatmap lets you see problems before they cause damage. You can act quickly to prevent overheating or power overloads.
Visualization
You should choose the right color scheme for your heatmap. Use cool colors like blue and green for safe zones. Use warm colors like yellow, orange, and red for warning and danger zones. This makes it easy to spot trouble areas. Interactive features help you explore the data. For example, you can hover over a section to see exact temperature or power values. You can zoom in on specific parts of the cabinet for a closer look.
Best practices for visualization include:
Use clear legends so you know what each color means.
Keep the layout simple and uncluttered.
Update the heatmap in real time for the most accurate view.
Integrate the heatmap with your remote monitoring system. This lets you check the status of your Telecom Cabinet Power Controller from anywhere.
Visualization Feature | Benefit |
|---|---|
Color Scheme | Quick identification of issues |
Interactivity | Detailed data exploration |
Real-Time Updates | Immediate awareness |
Remote Integration | Centralized monitoring |
Hotspot Detection
You need to find hotspots early to avoid failures. Sensors inside the cabinet monitor temperature, humidity, airflow, and power distribution all the time. Real-time data from these sensors helps you catch abnormal conditions, such as hotspots or unusual current levels, before they become serious. Visualization tools like 2D and 3D heatmaps give you instant insight into temperature and airflow patterns. You can see if one area gets too hot or if power does not spread evenly.
Recent research shows that using embedded sensors and machine learning models can make hotspot detection even more effective. These systems use predictive algorithms to spot trouble before it happens. For example, a study found that combining sensors with smart placement algorithms reduced power use by 7%, lowered temperature by 2%, and cut machine overhead by 28%. While this research focused on cloud data centers, you can apply the same ideas to your Telecom Cabinet Power Controller. With these tools, you can keep your equipment cool and avoid overloads.
Load heatmaps also help you find inefficiencies in your power system:
You see abnormal power or environmental conditions right away.
You can act before failures occur.
You maintain power efficiency and meet service level agreements.
You support proactive management by highlighting areas that need attention.
Tip: Use your load heatmap to schedule maintenance and balance loads. This keeps your system reliable and extends the life of your equipment.
Alarm/Event Timeline
Event Tracking
You need to track every critical event that happens in your Telecom Cabinet Power Controller. An alarm/event timeline helps you see when power or environmental issues occur. You can follow the sequence of alarms, such as voltage drops, temperature spikes, or door openings. This timeline gives you a clear record of what happened and when. You can use this information to understand the cause of problems and prevent them in the future. When you review the timeline, you spot patterns and recurring issues. This helps you improve your monitoring strategy.
Tip: Always check your event timeline after an incident. You will find clues that help you fix the root cause.
Visualization
A good alarm/event timeline uses simple visuals to show events in order. You can use a horizontal or vertical timeline with icons for each event type. Color coding helps you see the severity of each event at a glance. For example, use red for critical alarms, yellow for warnings, and green for normal events. You can filter the timeline to show only certain types of events, such as power failures or temperature alerts. Interactive features let you click on an event to see more details, like the exact time and sensor readings.
Visualization Feature | Benefit |
|---|---|
Icons & Colors | Quick event identification |
Filtering | Focus on key issues |
Interactivity | Detailed event information |
Maintenance Impact
Timely event tracking makes your maintenance work more effective. When you see an alarm right away, you can respond before the problem gets worse. You reduce downtime and protect your equipment. The timeline helps you plan preventive maintenance by showing you which issues happen most often. You can schedule checks for parts that trigger frequent alarms. This proactive approach keeps your Telecom Cabinet Power Controller reliable and extends its service life.
Note: Use your event timeline to create maintenance reports. These reports help you show compliance and improve your processes.
Chart Integration
Dashboard Layout
You need a dashboard that brings all your visual charts together. A unified layout helps you see voltage trends, load heatmaps, and alarm timelines at a glance. Place the most critical charts, such as voltage trend and load heatmap, in the top section of your dashboard. This arrangement lets you spot urgent issues quickly. Use clear labels and group related charts. You can add quick-access buttons for common actions, like exporting data or switching views. A well-organized dashboard reduces confusion and saves time during emergencies.
Tip: Arrange your dashboard so you can find important information in seconds. Group charts by function and use consistent icons for easy navigation.
User Experience
You want your monitoring interface to be simple and intuitive. Interactive features, such as zooming and filtering, help you explore data without extra steps. Responsive design ensures you can use the dashboard on any device, including tablets and smartphones. You should use tooltips and pop-up details to explain chart data. This approach helps new users understand the system faster. Color coding and clear legends make it easy to identify problems. You can customize the dashboard layout to match your workflow. A seamless user experience improves your ability to manage the Telecom Cabinet Power Controller efficiently.
Standards
You must follow industry standards and protocols to ensure your monitoring system works with other devices. These standards support interoperability, security, and scalability. The table below lists key protocols and standards for telecom cabinet monitoring interfaces:
Communication Protocols / Standards | Description / Application |
|---|---|
SNMP (v2, v3) | Network management protocol for monitoring and controlling devices, with SNMPv3 providing secure communication via proxy. |
HTTP / HTTPS | Web-based protocols for remote monitoring and control, with HTTPS ensuring secure data transmission. |
RS-232 / RS-485 | Serial communication standards used for direct device interfacing and control. |
Ethernet | Networking standard enabling device connectivity and data exchange in telecom environments. |
IPv4 / IPv6 | Internet Protocol versions supporting network addressing and routing for monitoring systems. |
Modbus | Industrial communication protocol for interfacing with power system components. |
Dry Contact Interfaces | Simple electrical contacts used for alarm inputs/outputs and status signaling. |
Following these standards gives you several benefits:
You ensure compatibility and safe operation within existing telecom infrastructure.
You support easy upgrades and maintenance with modular designs.
You enable reliable remote monitoring and control across different systems.
You reduce installation complexity and improve fault tolerance.
You prepare your system for future network growth and evolving technologies.
Note: Always check for compliance with NEBS Level 3, GR-3108, UL, CSA, and CE Marking when designing your monitoring interface.
You gain powerful tools for monitoring when you use voltage trend charts, load heatmaps, and alarm/event timelines. These elements help you keep your Telecom Cabinet Power Controller safe and efficient. Remote monitoring and centralized control give you fast access to critical data. You should follow best practices in interface design to improve reliability. For advanced techniques, explore resources on dashboard optimization and IoT integration.
FAQ
What is the main benefit of using visual charts in telecom cabinet monitoring?
Visual charts help you spot problems quickly. You see trends, hotspots, and events at a glance. This lets you act fast and keep your equipment safe.
How often should you check the voltage trend chart?
You should check the voltage trend chart daily. If you see sudden changes or spikes, review the chart more often. Regular checks help you catch issues early.
Can you customize the dashboard layout for different users?
Yes, you can customize the dashboard layout. You choose which charts to show and where to place them. This helps you match the dashboard to your workflow.
Tip: Ask your team what features they need most. Custom dashboards improve efficiency.
What standards should you follow for telecom cabinet monitoring interfaces?
Standard | Purpose |
|---|---|
SNMP | Device monitoring |
HTTPS | Secure data |
Modbus | Power system control |
Following these standards ensures compatibility and safety.
CALL US DIRECTLY
86-13752765943
3A-8, SHUIWAN 1979 SQUARE (PHASE II), NO.111, TAIZI ROAD,SHUIWAN COMMUNITY, ZHAOSHANG STREET, NANSHAN DISTRICT, SHENZHEN, GUANGDONG, CHINA

