How Smart PDU and Sensor Plug-and-Play Architecture Enable Smart Data Center Micro-Environment Management


A smart PDU delivers power intelligence at the rack and outlet level, and plug-and-play sensors deliver environmental data that configures itself on connection. Together, they give you granular, real-time visibility into each rack's micro-environment.
Room-level monitoring masks the problems that matter most. As Data Center Knowledge notes, room or zone sensors lack the granularity to pinpoint inefficiencies, so a rack running hotter than its neighbors stays hidden. The same blind spot applies to power imbalances across outlets. You need data from inside the rack.
This post explains how each technology works, how they integrate, and which benefits and implementation factors matter for your data centers.
Key Takeaways
Smart PDUs give you real-time power data at each rack. You can spot overloads and balance loads before problems happen.
Plug-and-play sensors configure themselves when connected. You save time on setup and get consistent environmental data across all racks.
One device combines power and environmental monitoring. You see temperature and power side by side, making alerts and analysis simpler.
Rack-level data boosts efficiency and reliability. You right-size capacity, cut energy costs, and catch hot spots early.
Start with a pilot rack to test the setup. Validate monitoring and alerts first, then expand with confidence.
What Are Intelligent (Smart) PDUs?
A smart PDU is a network-connected power strip with an embedded intelligence module. That module lets the device measure, monitor, and control power distribution, and it can talk to other systems over LAN or SNMP. The question of what are intelligent/smart PDUs really asks is how much visibility and control you get at the rack.
Core Capabilities
The primary features associated with intelligent PDUs include real-time data on power consumption, voltage, current, frequency, temperature, and humidity. Intelligent PDU technology also supports remote outlet switching, load balancing across phases or circuits, power sequencing, and alarm notifications, according to Hyperview. These power distribution units suit high-density racks that need granular control.
Monitored PDUs give you a full view of power usage at the rack and through remote access. Metered PDUs extend that base with outlet-level current sensing and support for temperature and humidity environmental sensors. Switched models add remote on, off, and reboot control per outlet, so you can define power-up order and avoid circuit overload during recovery.
The ESTEL Smart Power Distribution Unit
The ESTEL Smart Power Distribution Unit brings smart power distribution to your rack with a compact 1U form factor designed for 19-inch rack installations. It accepts 200-240VAC, 50/60Hz input and is built from durable metal sheet material.
Feature | Specification |
|---|---|
Form factor | 1U, compact design |
Rack compatibility | 19-inch rack installations |
Input power | 200-240VAC, 50/60Hz with a terminal |
Material | Durable metal sheet |
Protection | Surge protection, dehumidifying function |
This power distribution unit fits data centers that want metering, remote management, and environmental awareness in one device. You gain a single point for power and sensor data at each rack.
Smart PDUs: Power Intelligence at the Rack
Metering and Remote Control
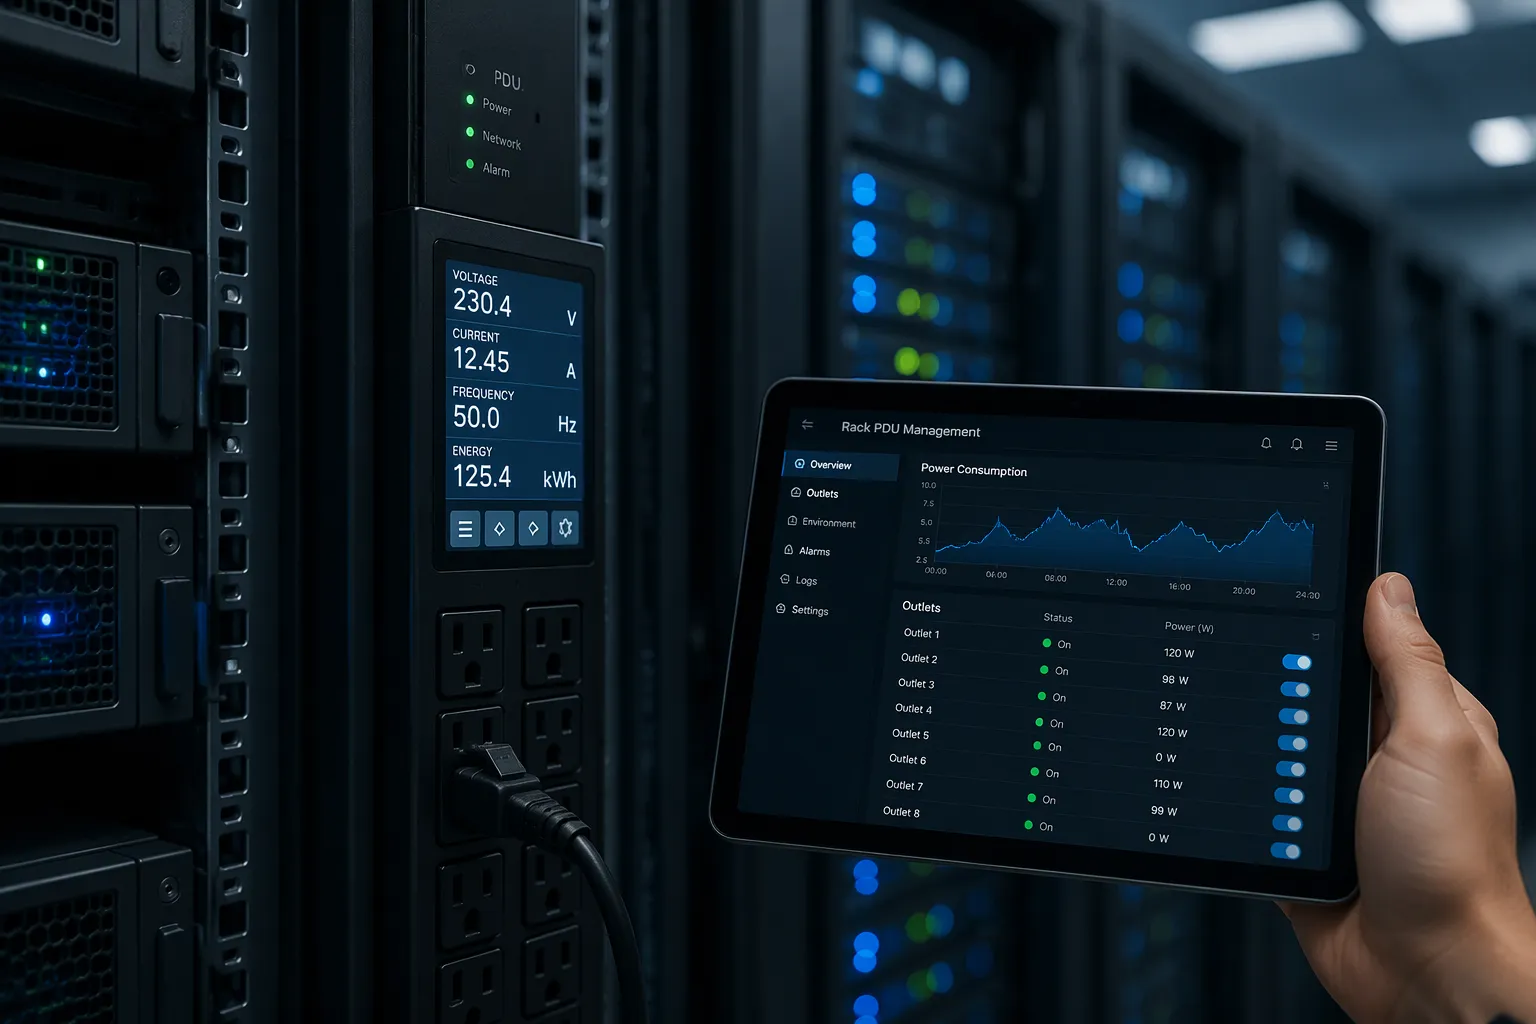
A smart PDU measures energy consumption with high precision. Most monitored power distribution units deliver accuracy of about ±1%, according to DEI Power. That tolerance covers voltage, current, active power, apparent power, and total energy, not just energy alone. Top-tier models reach ±0.5% under IEC 61557-12 PMD-III standards, yet ±1% remains the practical benchmark for most racks. Smart PDUs report these figures continuously, so you spot drift before it becomes a billing dispute. An intelligent PDU also logs history for later review.
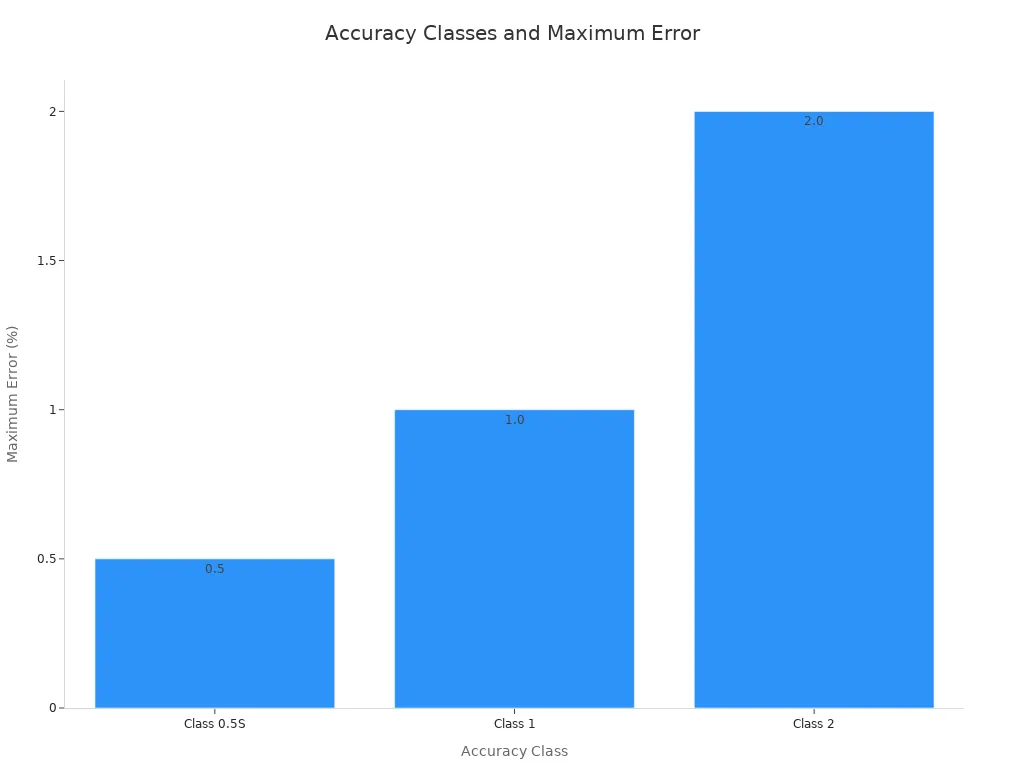
Billing-grade accuracy in a metered PDU means the device measures electrical parameters with a maximum error of ±1%, meeting internationally recognized metrology standards like IEC 62053-21 Class 1, as nbyosun.com explains.
The chart below from nbyosun.com compares the maximum error allowed under three IEC 62053-21 accuracy classes.
Remote management completes the picture. You can schedule outlet power on/off and check consumption from anywhere. A smart rack PDU lets you monitor usage at the outlet and control individual outlets without walking the floor. That remote reach shortens response time during maintenance windows.
Why Rack-Level Visibility Matters
Rack-level power metrics protect you from overloads in busy data centers. Real-time power monitoring shows whether a rack or circuit is nearing its limit before a failure occurs, according to Yosun PDU. You can redistribute loads early and avoid protective shutdowns that cut equipment lifespan and create downtime. Faster troubleshooting follows too, because abnormal consumption points straight to the problem circuit.
Visibility also supports load balancing and capacity planning. In three-phase Wye configurations, unbalanced loads push current through the neutral, which causes heating and reduces efficiency. DEI Power notes that phase balance monitoring prevents neutral overload. Real-time monitoring also lets you compare actual load against rated capacity, so you right-size power infrastructure and plan growth with confidence. This level of monitoring, management, and control turns raw readings into operational visibility across your data center. A smart PDU therefore pays for itself through safer deployment and more efficient maintenance.
Sensor Plug-and-Play Architecture
Plug-and-play sensor architecture means a sensor identifies itself and configures itself the moment you connect it. No address tables, no manual driver binding, no spreadsheet of which port holds which probe. The management system learns what is present and starts collecting data.
Auto-Discovery and Auto-Configuration
Discovery follows a defined sequence. Industrial Monitor Direct describes the process this way:
Establish reachability on the intended bus branch.
Read the descriptor using a defined transaction, parsing only specified fields such as device type, version, and unique ID.
Validate identity and compatibility against drivers the host already supports.
Resolve address and branch ownership to rule out conflicts.
Initialize and poll with timeouts, recording failure separately from "device absent."
Repeat discovery on an application-defined schedule and after any detected connection change.
A descriptor is metadata, not a driver. Industrial Monitor Direct stresses that a successful generic scan does not establish device type, so the host must map descriptor contents to supported software. Research on plug-and-play sensor buses, published on arXiv, takes a related approach: a driver-level Physical Mask updates directly from connect and disconnect events, exposing sensor presence as an explicit runtime signal that drives auto-configuration and graceful degradation when sensors are hot-plugged.
Faster Deployment, Cleaner Data
Connect environmental sensors into a rack PDU and you can watch the temperature and humidity around mission-critical IT assets continuously. That proximity matters in data centers, where a single warm rack can sit invisible behind a comfortable room average.
Deployment speed follows directly. You spend less time on manual configuration and more on commissioning. Consistent data collection is the second gain. Every sensor reports through the same path with the same parsing rules, so readings stay comparable across racks and over time. Faster time to insight is the third. Your environmental monitoring starts producing usable history on day one, and you can compare racks without cleaning up mismatched records first.
Smart PDU and Sensor Integration
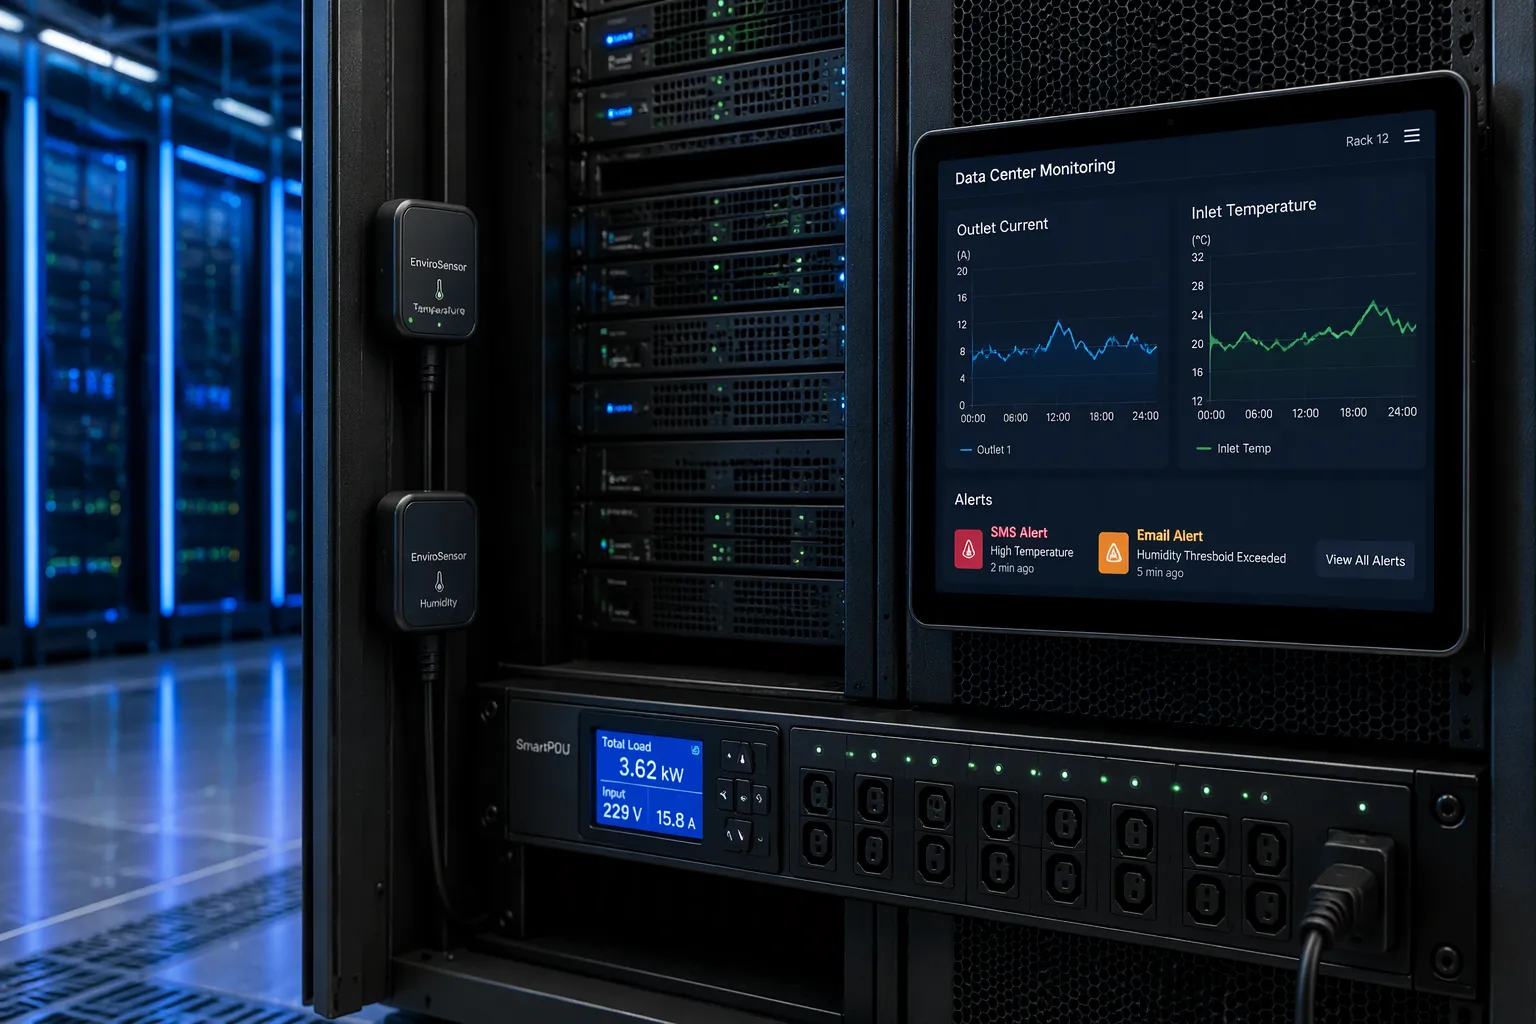
Integrating an intelligent PDU with plug-and-play sensor hardware merges two data streams into one rack-level view. Power and environmental data arrive through the same device, so you see outlet current and inlet temperature side by side instead of in separate tools. Vertiv notes that a smart PDU can incorporate environmental sensors to monitor rack conditions without a separate monitoring solution. That single view is the foundation for everything below. You stop reconciling two dashboards and start reading one.
Real-Time Monitoring and Alerting
Real-time monitoring starts with thresholds you define. Dataspan recommends staging temperature alerts at several levels of increase, with a final critical alert as readings approach the maximum. Humidity works well with two tiers: early warnings near 40% and 60%, and emergency notifications near 30% and 70%.
Temperature: multiple staged warnings plus a final critical alert near the maximum threshold.
Humidity: early alerts around 40% and 60%, emergency alerts around 30% and 70%.
Power draw deserves the same treatment. Monnit reports that its devices can flag abnormal rack or HVAC duct temperatures and increased power draw, and you choose whether an unusual state triggers an SMS text, email, or call. Alerts can also travel through a gateway using SNMP. Vertiv adds that warning and critical thresholds catch overload conditions before a breaker trips, delivered as SMS, SNMP traps, or email. Detection works remotely and locally, so a technician on the floor and an engineer offsite both receive the signal. In dense data centers, one rack can drift out of range while the room average still looks healthy. A staged alert scheme buys you time: you fix a drifting inlet temperature before it becomes an outage. Escalation paths matter as much as the numbers themselves. Route critical alerts to on-call staff and warnings to a shared queue.
From Data to Actionable Insight
Raw readings become insight through a repeatable workflow. Xometry lays out five steps:
Deploy monitoring tools such as DCIM platforms and smart PDUs.
Measure key metrics including power usage, PUE, and rack utilization.
Configure alerts for overloads and abnormal usage.
Analyze historical reports to find inefficiencies.
Validate performance against efficiency targets.
DCIM integration closes the loop by feeding rack data into centralized management, where trends across rows and halls become visible.
Analytics also support cooling efficiency. Cooling consumes roughly 30% to 40% of total data center electricity, per Xometry, so thermal data at the rack carries real financial weight. Real-time power monitoring paired with sensor readings lets you compare actual load against cooling response. Liquid cooling benefits most. Higher rack densities produce greater thermal loads, and Xometry notes that liquid cooling and optimized airflow reduce cooling energy demand while holding safe temperatures. A published AI cooling workflow fuses server power, environmental readings, and external data, then adjusts valves and fans against a server inlet limit of 27°C from ASHRAE standards. You do not need AI to begin. Consistent smart PDU and sensor data give any analytics layer the inputs it needs. Review the history weekly at first, then monthly once patterns settle.
Data Center Efficiency, Capacity, and Reliability
Energy Efficiency and Capacity Planning
Precise monitoring lets you right-size power infrastructure instead of guessing at headroom. The U.S. Department of Energy's ENERGY STAR program describes the payoff directly:
Data Center Infrastructure Management (DCIM) is the convergence of IT and building facilities functions so that energy, equipment and floor space are used as efficiently as possible. DCIM provides information to allow you to "right-size" the infrastructure and reduce energy costs by as much as 30 percent.
Real-time monitoring turns that potential into routine practice. Hanwha Data Centers reports two concrete gains:
Real-time monitoring systems enable 15-20% efficiency gains through automated optimization
Modular infrastructure design allows precise capacity matching without overprovisioning
Rack-level power and environmental data also sharpen capacity planning. You can balance loads across circuits with confidence and base growth decisions on measured demand rather than nameplate ratings. TierPoint notes that AI can predict future power demands and adjust consumption as workloads fluctuate, and that automating provisioning keeps servers matched to workload demands without exceeding them.
Reliability Through Early Detection
Early detection protects uptime. Thermal pattern drift, unexpected warm spots, and cooling lag all signal trouble before a failure, according to Frizb. The same source flags environmental drift alerts for humidity, condensation, and dust buildup, because small changes in the room often correlate with later failures. Thermal hotspot detection on racks and converters prevents overheating-driven faults.
Infrared scanning adds a proven layer. IR Analyzers calls it one of the simplest ways to catch electrical problems early, since overloaded breakers, loose connections, phase imbalances, and ventilation issues all show up through a thermal lens. Updated NFPA 70B (2023) guidelines recommend scanning all electrical equipment at least once a year, with semiannual or quarterly scans for systems showing wear.
A layered approach works best for data center operations. Sensors catch drift continuously, scans catch what sensors miss, and alerts reach you remotely or locally. MultisensorAI notes that historical trending helps teams distinguish transient spikes from real degradation. That combination keeps data centers ahead of the failures that cause downtime.
Implementation with ESTEL
Compatibility, Scalability, and Cost
Start with compatibility. Check that the unit integrates with your existing data center infrastructure management platform and supports the protocols your building or energy management systems already use, such as Modbus or BACnet. The ESTEL Smart Power Distribution Unit supports intelligent protocols and remote management, so it fits into centralized monitoring without a separate tool. These are the core tips for selecting the right PDU: verify protocol support, confirm the outlet mix, and plan for sensor ports before you order.
Scalability and cost belong in the same conversation. The ESTEL unit offers cabinet and rackmount configurations, so you can match capacity to each rack instead of overbuying. Modular and upgradeable designs let you expand without replacing the whole unit, which lowers future upgrade costs. ESTEL builds every smart power distribution unit under ISO9001 quality control, and the robust chassis protects your investment over a long service life.
Designing for Growth
Begin with a pilot rack. Deploy one smart PDU with sensors, then validate fit, function, and monitoring before you scale. Label every outlet and circuit clearly, and set alert thresholds before deployment. Review rack load after each major change, and use the historical data to guide future rack builds.
A pilot also proves your DCIM integration early. ASHRAE guidance ties thermal management to equipment intake conditions rather than room feel, and cabinet-level sensor data shows whether a rack stays inside its operating envelope. That evidence makes the case for wider rollout across your data centers. ESTEL focuses on quality, innovation, and customer satisfaction, so your pilot becomes a reference design for the next row.
A smart PDU and plug-and-play sensors turn rack-level power and environmental readings into continuous, actionable micro-environment management. You gain efficiency from precise monitoring, capacity confidence from measured load data, and reliability from early detection of hot spots and overloads.
Put this architecture to work with a pilot rack. Evaluate the ESTEL Smart Power Distribution Unit and its sensor portfolio in one rack first. Validate the fit, the monitoring, and the alerts before you scale across your data center. That single rack proves the design, and it gives your team a reference for every row that follows. You then expand with evidence, not assumptions, and your data centers grow on a proven foundation.
FAQ
What accuracy does a smart PDU deliver for power readings?
Most monitored units measure within about ±1%, and that tolerance covers voltage, current, active power, and total energy. You can trust the readings for load balancing and capacity decisions. Higher-tier models reach tighter tolerances under recognized metrology standards.
What form factor does the ESTEL Smart Power Distribution Unit use?
It uses a compact 1U design built for 19-inch rack installations, with 200-240VAC, 50/60Hz input and a durable metal sheet construction. Match the configuration to each rack instead of overbuying capacity.
Do plug-and-play sensors need manual configuration?
No. Each sensor identifies itself and configures itself on connection. Your management system reads the descriptor, validates compatibility, and starts collecting data. You skip address tables and driver binding, so deployment moves faster and readings stay consistent across every rack in your data center.
Can one device report both power and environmental data?
Yes. Connect temperature and humidity sensors into the rack PDU, and power plus environmental readings arrive through one device. You see outlet current beside inlet temperature in a single view. That combined picture supports threshold alerts and thermal analysis without a second monitoring tool.
How should I start deploying this architecture?
Begin with a pilot rack. Deploy one smart PDU with sensors, then validate fit, monitoring, and alerts before you scale. A pilot proves your DCIM integration early and becomes a reference design. You then expand across your data centers with evidence rather than assumptions.
See Also
Understanding ESTEL PDUs And Their Function In Data Center Cabinets
Simple Guide To Organizing Cables In Data Center Cabinets
ESTEL Smart Microgrid Integrated Telecom Cabinet Energy Storage System Overview
Optimizing Outdoor Cabinets With Power Cooling And Monitoring Solutions
Guide To Installing And Maintaining Smoke Sensors In Communication Cabinets
CALL US DIRECTLY
86-13752765943
3A-8, SHUIWAN 1979 SQUARE (PHASE II), NO.111, TAIZI ROAD,SHUIWAN COMMUNITY, ZHAOSHANG STREET, NANSHAN DISTRICT, SHENZHEN, GUANGDONG, CHINA
