How Smart PDU Spare Part Management Uses Failure Rate Prediction in Telecom Cabinets

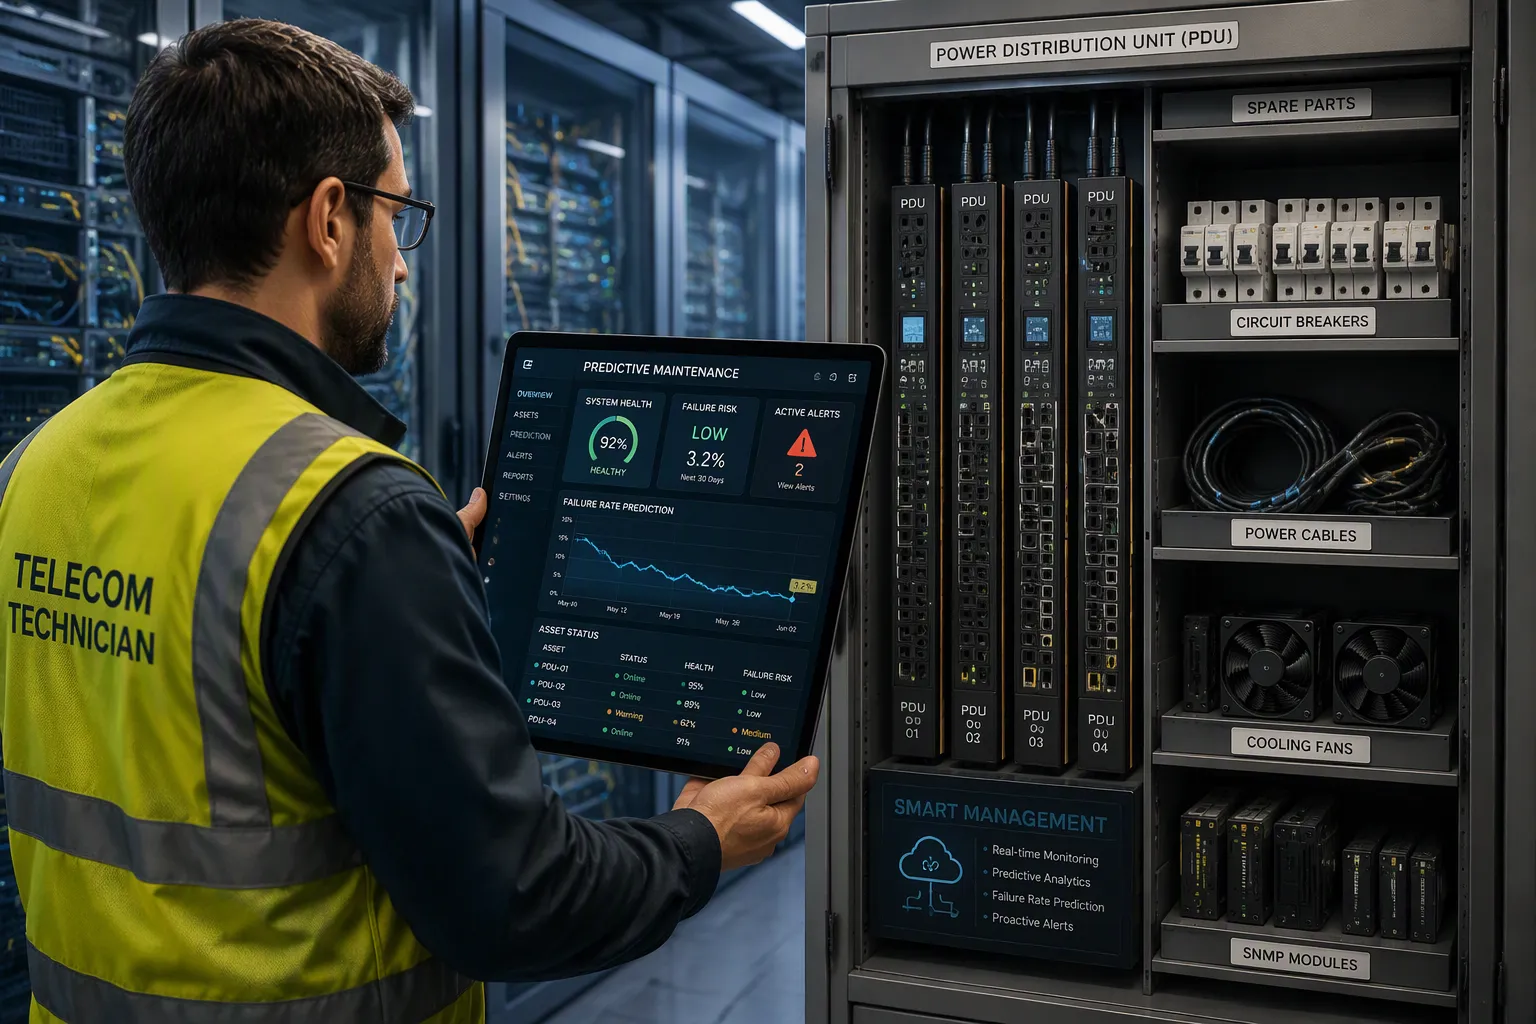
Smart PDU spare part management uses failure rate prediction to anticipate component breakdowns, stock the right parts ahead of time, cut downtime, and control costs. Unplanned PDU failures in a telecom cabinet disrupt service and strain budgets. You face emergency truck rolls, expedited shipping charges, and service-level penalties. Meanwhile, shelves hold the wrong spares while critical parts run out. That gap between guesswork and evidence costs money every quarter. This post explains what failure rate prediction is, how it works, and how to apply it in your cabinets. You will see how sensor data and analytics turn reactive repairs into planned replacements. No background filler — just the mechanics and the practical steps.
Key Takeaways
Smart PDUs collect real-time data on power, temperature, and humidity to predict failures.
Failure rate prediction uses data and analytics to forecast component breakdowns before they happen.
Predictive maintenance reduces downtime and costs by stocking the right spare parts at the right time.
Start with critical spares and clean data to build a successful prediction program.
ESTEL's Smart PDU solutions support predictive maintenance with remote monitoring and control.
Smart PDU Basics and Failure Rate Prediction
What Makes a Smart PDU Smart
A smart PDU is an intelligent power distribution unit. It distributes power like a basic unit, but it also monitors, controls, and reports data. You get real-time metering at the unit level and the outlet level. You can reach the device through a web interface, SNMP, or Telnet/SSH. You can switch an outlet on, off, or reboot it from anywhere. The unit sends alerts when your pdu load crosses a threshold you set. Environmental sensors track temperature, humidity, and airflow inside the rack. APIs push that data into DCIM or BMS platforms.
Capability | Traditional PDU | Smart PDU |
|---|---|---|
Monitoring | None or limited | Real-time, unit and outlet level |
Remote access | Not available | Web GUI, SNMP, Telnet/SSH |
Remote control | Not available | Outlet-level on/off/reboot |
Alerts | None | User-defined thresholds |
Environmental sensors | None | Temperature, humidity, airflow |
DCIM/BMS integration | No | Yes, via APIs |
This intelligent power monitoring and control turns each cabinet into a data source. That data feeds every later decision about spares.
Defining Failure Rate Prediction
Failure rate prediction forecasts when PDU components are likely to fail. It draws on historical data, sensor readings, and analytics models. Reliability prediction standards supply the statistical methods. Common examples include MIL-HDBK-217, Telcordia SR-332, 217Plus, IEC 61709, SN 29500, and GJB/z 299. These standards give equations for electrical and mechanical components. The engine calculates the overall failure rate and MTBF once you describe the components and their characteristics.
You apply the same logic to pdu breakers, relays, and power modules. Failure prediction models track how each part behaves across the life cycle of pdus. The prediction tells you which spare to stock and when to order it. That is how reliable power distribution becomes a planned activity instead of an emergency.
Predictive Maintenance for Data Centers and Telecom Sites

Predictive maintenance for data centers and telecom sites runs on three stages: data collection, modeling, and forecasting. Each stage feeds the next. Skip one and the chain breaks.
Data Collection from Smart PDU Sensors
Your smart PDU is the first link. It logs outlet-level energy use, temperature, humidity, and airflow around the clock. Event logs record every trip, reboot, and threshold breach. Maintenance records and service histories add the human side of the story. Part usage history shows which spares you actually consume and how often.
Sensor Category | Specific Sensors | Role in Prediction |
|---|---|---|
Environmental | Temperature, humidity, airflow, power consumption | Detect overheating, condensation, and power anomalies early |
Security / Access | Contact closure, vibration, proximity | Flag tampering and unauthorized access |
Modular | Level, temperature, flow, oil humidity, vibration, air humidity | Protect critical hardware from moisture ingress |
Power monitoring | Outlet-level energy sensors with IoT/AI | Track energy per outlet and spot underperforming hardware |
Watch pdu load trends across weeks. A slow upward drift in one cabinet often signals a failing fan or a blocked intake. That is how cooling failures announce themselves before the rack overheats.
AI Predictive Maintenance Models
Modeling comes next. Machine-learning algorithms scan part usage and failure rates for patterns. An ai predictive maintenance system in a CMMS combines failure data, lead times, and maintenance information to forecast spare demand. Machine-learning anomaly detection flags readings that fall outside normal behavior. These failure prediction models learn from every prediction and improve over time.
Forecasting follows. Simulation modules model breakdown and repair for repairable spares and predict downtime, service levels, and inventory cost for your current rotating pool.
Benefit | How the Simulation Module Delivers It |
|---|---|
Accurate modeling | Simulates part breakdown and repair for repairable spares |
Key metrics | Forecasts downtime, service levels, and inventory costs |
Stocking guidance | Shows how many spares meet short- and long-term service targets |
Operational decisions | Supports the choice to wait for repairs or buy from suppliers |
Waste avoidance | Prevents unnecessary purchasing and equipment downtime |
One high-value case deserves attention: predictive failure detection for UPS battery string failure. Battery strings degrade quietly. An ai-driven predictive maintenance workflow tracks ups degradation and ups component degradation through voltage and impedance trends. It raises a predictive maintenance event before the string drops the load. Treat that alert as a scheduled replacement, not an emergency.
From Predictions to Smart PDU Spare Part Management
Predictive Failure Detection and Inventory Optimization
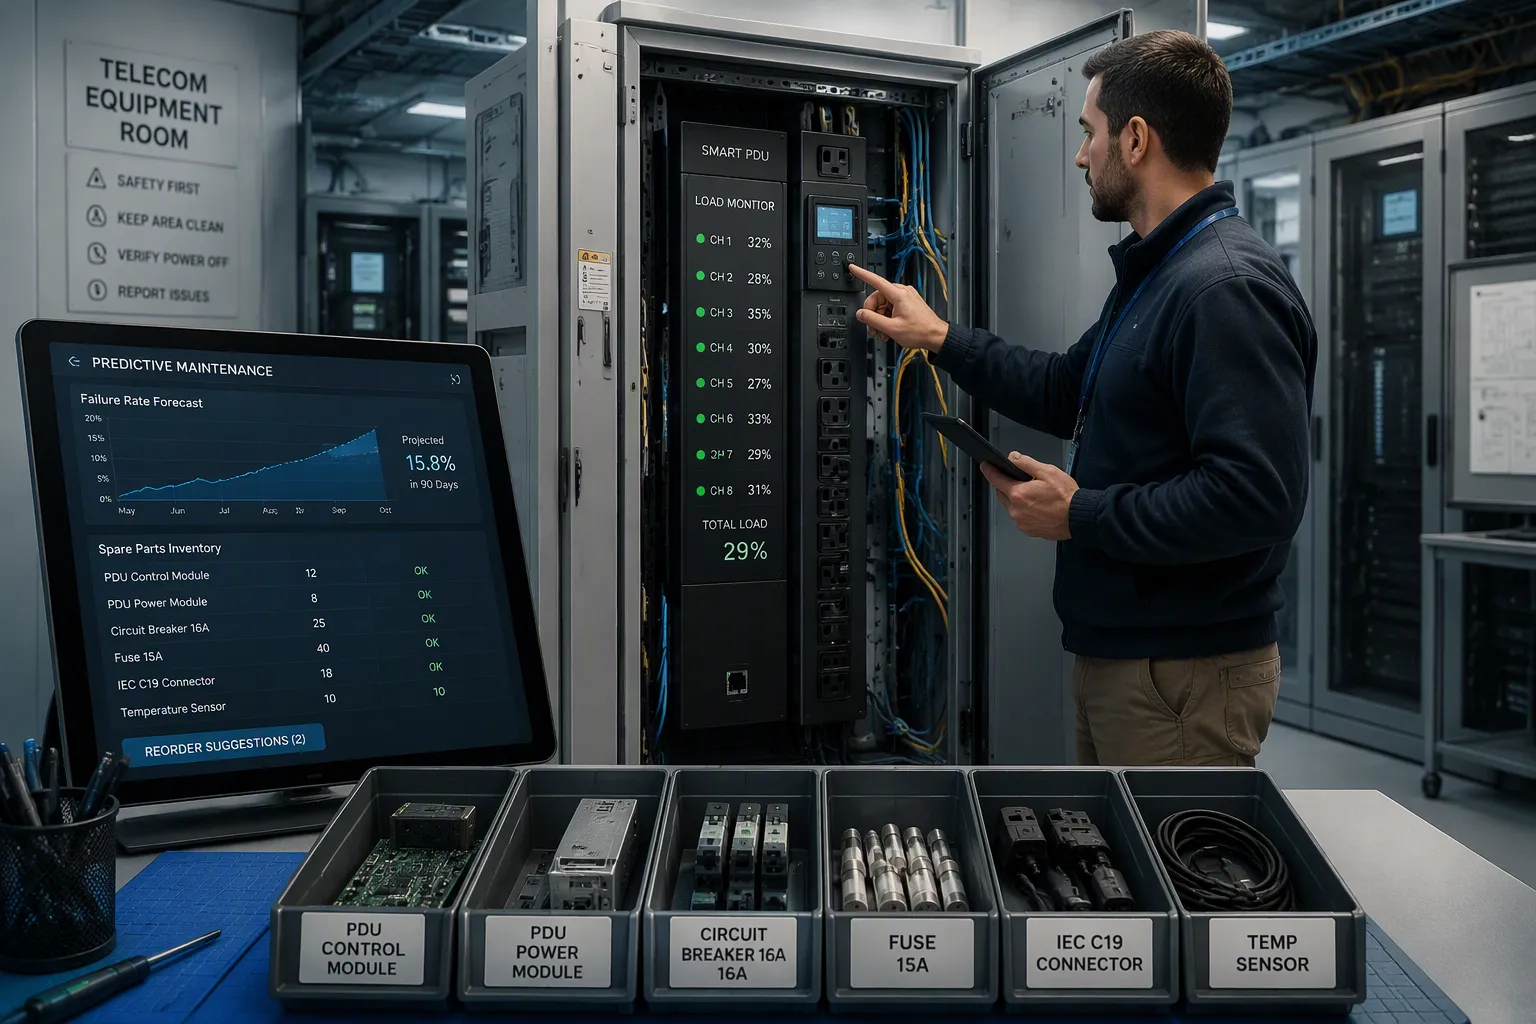
Forecasts answer three questions for every spare: which part, how many, and where. Predictive failure detection links each prediction to a specific asset in a specific cabinet. You then stock the right part at the right site in the right quantity. A part that fails at a remote mountain site needs different placement than one that fails in a metro hub. Use pdu load trends and pdu load balance readings to rank sites by stress. A cabinet running near its limit deserves a local spare. A lightly loaded cabinet can share a pool.
Prediction accuracy improves when you feed it clean data. Track pdu load per outlet, log every trip, and record each replacement. The model then separates random failures from wear-driven ones. That distinction shapes your stocking policy. Wear-driven parts follow a schedule. Random failures call for pooled safety stock.
Automated Replenishment and Risk Mitigation
Automated triggers turn a forecast into a purchase order. The workflow runs in three steps:
Reserve — allocate on-hand inventory to the predicted repair so unrelated work cannot consume it.
Replenish — issue purchase orders sized to predicted demand plus safety stock, timed backward from the predicted failure date minus lead time.
Stage — move reserved parts to a kitting area so the technician can execute the repair without searching.
Set the forecast horizon by supplier lead time, not the calendar: if a critical part takes 45 days to arrive, a 30-day forecast cannot protect availability no matter how accurate it is.
Confidence should drive the action. A steep degradation curve with a narrow failure window justifies immediate commitment. A weak signal justifies watching only.
Prediction confidence | Replenishment action |
|---|---|
High-confidence, near-term (steep degradation, narrow failure window) | Reserve and, if lead time demands it, replenish immediately |
Medium-confidence | Soft reservation (hold stock for the asset) plus supplier availability check |
Low-confidence / intermittent | Monitor only — do not order |
Condition-based signals strengthen the chain. Configure them on asset thresholds such as vibration, temperature, and run-hours. When a threshold is crossed, a replenishment signal fires alongside the maintenance alert. The part is already on order before the technician opens the work order.
Safety stock calculations use real delivery variance — not optimistic catalog lead times that consistently underestimate your true replenishment cycle.
Risk mitigation starts with prioritization. Rank spares by the cost of their absence, not their price. A cheap relay that idles a site outranks an expensive module with a long service life. Plan ups battery string failure replacement as a scheduled event. An ai predictive maintenance model flags the degrading string, and you book the swap before the load drops. This is where early warning before critical asset failure pays for itself. Optimizing inventory strategies in spare parts inventory management can significantly reduce downtime, and an ai-driven predictive maintenance program supplies the evidence those strategies need. Treat every actionable predictive alerts message as a work order trigger, not a dashboard curiosity. Cooling failures and other slow-onset faults follow the same path: detect, predict, reserve, replace. Each closed loop sharpens the next prediction.
Deploying ESTEL Smart Power Distribution Unit Solutions
Implementation Steps and ESTEL Support
You deploy a smart PDU in four stages. First, install the unit and its sensors. Clean the workspace with a HEPA-filter vacuum, position the unit for unrestricted airflow, secure it with mounting brackets, and ground it to the cabinet's grounding point. Verify the ground with a multimeter. Second, connect an analytics platform. Third, integrate with your inventory and CMMS systems. Fourth, set replenishment rules tied to predicted failure windows and lead times.
ESTEL's Smart Power Distribution Unit supports this workflow directly. It offers remote management, surge protection, a dehumidifying function, an LCD display for real-time monitoring, 8 to 19 outlet configurations, and a 16A maximum input current. These features feed monitoring data into prediction workflows. Real-time monitoring tracks energy use and temperature continuously. Environmental sensors watch humidity to prevent condition-induced failures. Remote management enables quick response to issues. Redundancy options provide backup during unexpected events.
Benefits, Challenges, and Best Practices
The benefits are measurable. AI-driven algorithms analyze power usage data and identify patterns that signal impending trouble. Measured outcomes include unplanned downtime reduced by 25%, power outages reduced by 15%, and network reliability improved by 20%. Predictive maintenance schedules repairs only when needed, reducing unnecessary site visits and costs. Real-time energy measurement optimizes consumption and supports capacity changes.
Three challenges deserve attention. Data quality tops the list — dirty sensor readings produce false predictions. Best practice: clean and validate data before it reaches the model. Model accuracy comes second. Best practice: retrain models as new failure data arrives. Cost comes third. Best practice: start with critical spares and expand coverage as confidence grows. Treat predictive maintenance as an intelligence layer that feeds your existing CMMS, not a replacement for it. The CMMS remains the system of record for work orders and parts inventory. AI can detect PDU degradation precursors and provide advance warning. That window lets you pre-position critical spares before failure.
Failure rate prediction turns smart PDU data into proactive spare part decisions. Sensor readings and event logs feed models that forecast which component will fail and when. You stock the right part at the right cabinet before the failure happens. That shift from reaction to planning delivers higher uptime, lower costs, and more efficient operations across your telecom sites.
Start small. Collect clean sensor data, connect an analytics platform, and let the prediction engine learn from your maintenance records. ESTEL's Smart Power Distribution Unit supports this journey with remote management, real-time monitoring, and reliable power distribution your prediction workflow can trust.
FAQ
What data does a smart PDU need to predict failures?
You need continuous sensor readings, event logs, maintenance records, and part usage history. The unit's environmental sensors track temperature, humidity, and airflow. Outlet-level energy data shows load trends. Clean, validated data matters most — dirty readings produce false predictions and wasted orders.
How far in advance can failure prediction warn you?
AI models can detect degradation precursors and provide advance warning. That window lets you reserve and pre-position critical spares before a failure occurs. Set your forecast horizon by supplier lead time, so slow-moving parts arrive in time.
Does failure rate prediction make sense for small telecom sites?
Yes, with a narrower scope. Start with critical spares and expand coverage as confidence grows. Low-demand parts benefit most — dedicated forecasting methods can cut forecast error compared with simple averages.
How do you measure the return on a prediction program?
Track unplanned downtime, outage frequency, and network reliability before and after deployment. Reported outcomes include unplanned downtime reduced by 25%, power outages reduced by 15%, and network reliability improved by 20%. Also compare emergency shipping costs and truck rolls against planned replacement spending.
What role does the PDU play in the prediction workflow?
The pdu acts as the data source. Its remote management, real-time monitoring, and environmental sensors feed readings into your analytics platform. ESTEL's Smart Power Distribution Unit offers 8 to 19 outlet configurations and a 16A maximum input current, so monitoring data flows into prediction workflows from day one.
See Also
Ensuring Consistent Power Delivery For Telecom Cabinet Operations
Understanding ESTEL PDUs And Their Function In Data Centers
Achieving Best Monitoring Practices For Outdoor Telecom Cabinet Systems
Calculating Telecom Cabinet Power Systems And Battery Requirements
Solar Energy Storage Power Systems For Telecom Cabinet Applications
CALL US DIRECTLY
86-13752765943
3A-8, SHUIWAN 1979 SQUARE (PHASE II), NO.111, TAIZI ROAD,SHUIWAN COMMUNITY, ZHAOSHANG STREET, NANSHAN DISTRICT, SHENZHEN, GUANGDONG, CHINA
