Fine-Grained Energy Efficiency Metering of Telecom Rectifier Systems: Branch-Level Electricity Statistics for Precise Energy Consumption Analysis

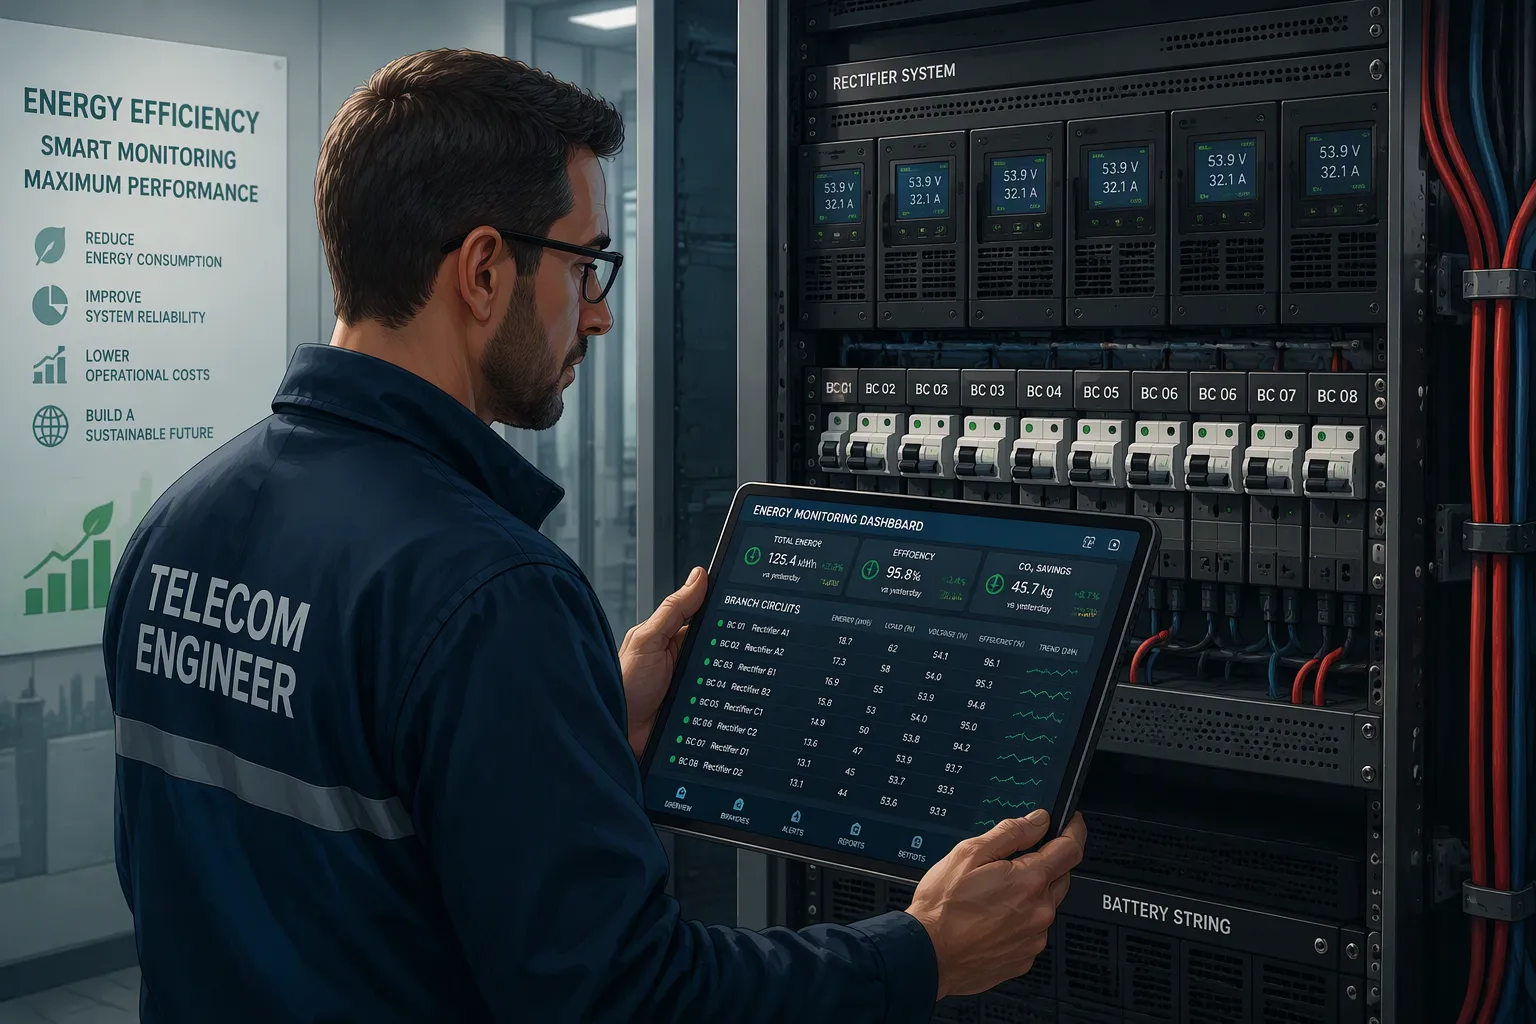
You cannot control what you cannot see. Telecom rectifier systems sit at the heart of site power delivery, so fine-grained metering directly shapes energy efficiency and operating cost control. Your core goal is simple: obtain branch-level electricity statistics as the foundation for precise energy consumption analysis. Aggregate site readings hide where consumption actually occurs, and that gap limits every efficiency decision you make. This article answers three questions. First, what challenges block accurate monitoring. Second, which complementary solutions exist for branch-level measurements. Third, what results these approaches deliver in practice. Each answer moves you closer to energy data you can act on.
Key Takeaways
Branch-level metering shows exactly where electricity goes in a telecom site.
Aggregate metering hides problems like failing rectifiers and wasted energy.
Different metering tools work together to cover the whole power chain.
ESTEL rectifier systems achieve high efficiency and save energy costs.
Start with the worst-performing sites and add sub-metering step by step.
Why Fine-Grained Monitoring Matters
From Site Totals to Branch Visibility
Global data center electricity estimates for 2020 ranged from 196 to 1200 TW·h. That spread is enormous. It shows how much credible efficiency claims depend on granular measurement rather than rough site-level guesses. You face the same problem at a smaller scale. A single site total tells you how much power the whole installation draws. It does not tell you which rectifier, which load, or which feed drives that figure.
Branch-level statistics solve this. They break aggregate site consumption into per-rectifier, per-load, and per-distribution-feed figures. Each branch inside the electricity distribution panel becomes a visible line of data. You can then compare one rectifier against another and spot the outlier. Per-branch current readings turn a vague total into a set of accountable numbers. This is the practical value of fine-grained monitoring: every kilowatt has an owner.
The Limits of Aggregate Metering
Aggregate metering has a structural blind spot. It reports one number for the whole site, so a failing rectifier hides behind a healthy average. You cannot isolate losses, and you cannot verify an efficiency upgrade. Industry guidance on energy-use breakdowns addresses this directly. System-level metering should cover at least 40% or 80% of total expected annual energy consumption, depending on the breakdown approach you follow. That threshold forces you to meter the loads that actually matter.
Reaching that coverage takes deliberate design. Electric sub-metering at the panel level gives you the resolution to allocate electricity usage across rectifiers and loads. A power analyzer confirms accuracy during commissioning. Together, these energy measurements support real analysis instead of assumption. The next step is choosing the right combination of tools for your site.
Challenges in Telecom Rectifier Systems Metering
Accuracy and Measurement Drift
The central challenge is a balancing act. You need high estimation accuracy for fine-grained electricity usage, yet you want to use low-cost sensing devices and keep installation and maintenance demands on end users to a minimum. These goals pull against each other. A cheap sensor may drift over time, and drift erodes the trust you place in every downstream number.
No single approach solves this for everyone. Distinct solutions must accommodate the varying needs of different end users. A small site and a large central office face different constraints, so your energy estimation methodology should match the site. A power analyzer during commissioning helps you verify accuracy, and periodic checks catch drift before it distorts your energy consumption picture.
Cost and Installation Constraints
Cost shapes every decision in telecom rectifier systems metering. Electric sub-metering systems add hardware, wiring, and labor, and each item carries a price. You must weigh that spend against the value of the data. Electric sub-metering at the electricity distribution panel gives you branch visibility, but the installation itself takes time and planning.
Privacy is a design consideration, not a reason to skip metering. Fine-grained electricity usage information is highly identifying. Research on a 2.5M-household dataset found that five consecutive half-hourly measures re-identified over 90% of households on average. Even a series rounded to the nearest 100 W still re-identified more than 40% of households from seven consecutive measures. Approximate knowledge is enough for re-identification.
The same source notes that providers often collect more detailed consumption data than billing requires, and smart plugs send measurements to third-party systems. Non-Intrusive Load Monitoring can infer appliance usage, occupancy, and socio-economic metrics from a fine-grained series. Such data fall under personal data protection laws, and pseudonymization alone is insufficient. Design your monitoring with these risks in mind, and keep the data you collect proportionate to the analysis you need.
Complementary Metering Solutions Compared
Matching Approaches to Application Fit
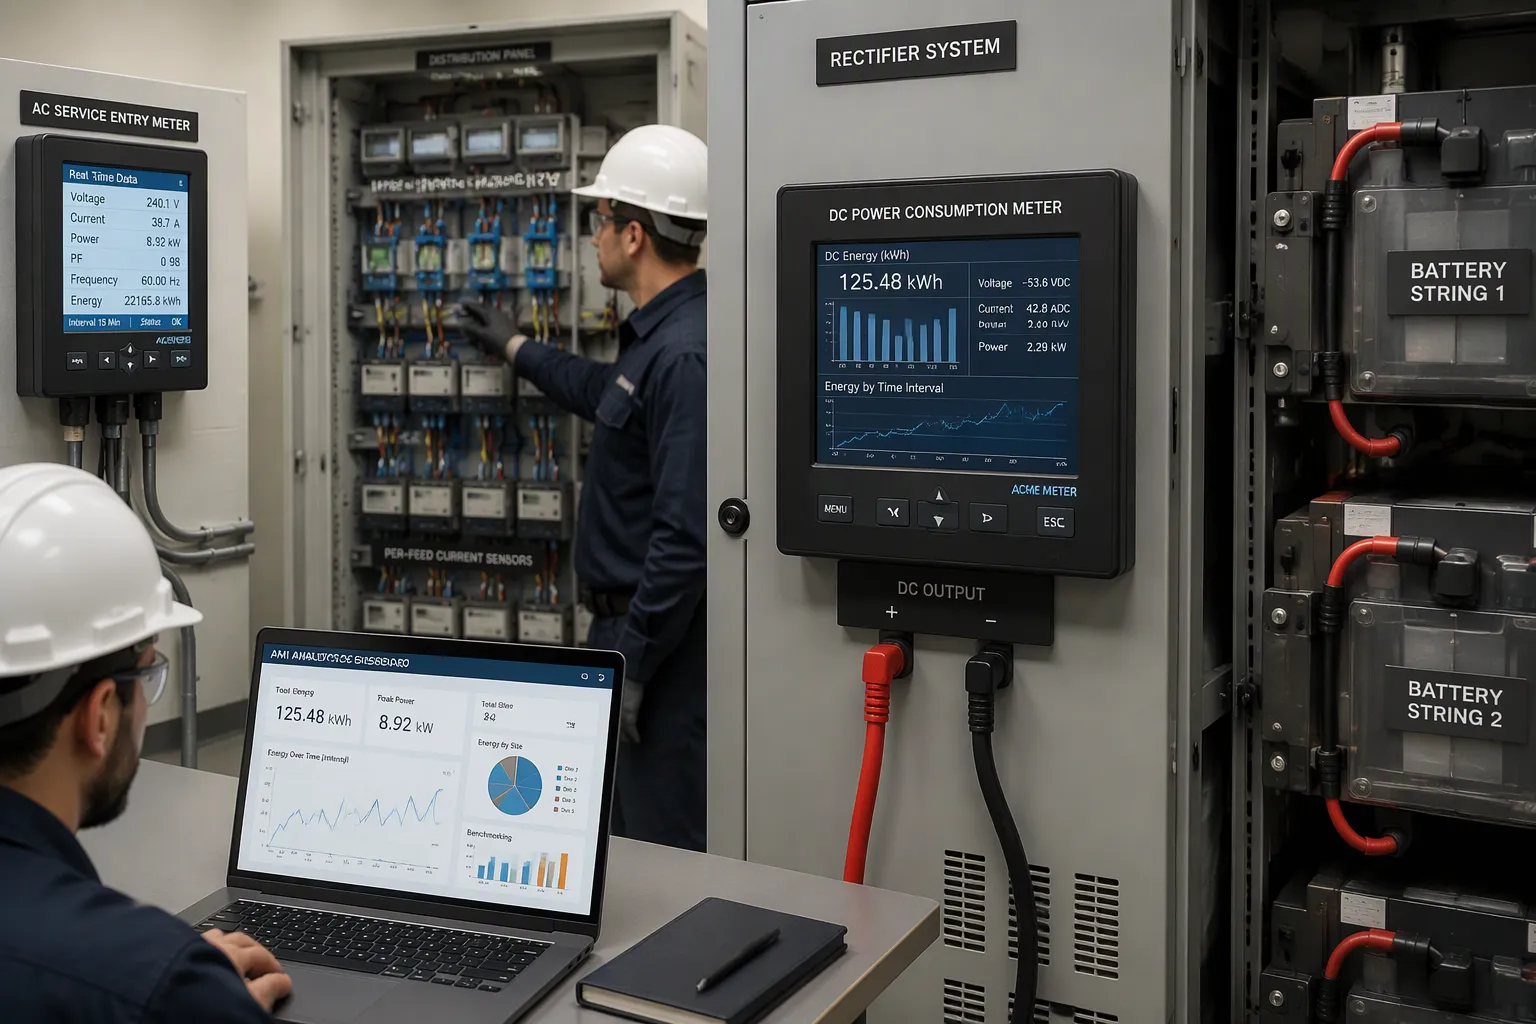
No single device covers every branch in telecom rectifier systems. Each option earns its place by matching a specific job. DC power consumption meters fit the rectifier output side. They store data and present measured energy consumption as charts, so you can see patterns and spot savings opportunities at a glance. Pair them with intelligent control systems and the meters feed finer-grained management, letting the system adjust equipment status on demand.
Smart meters serve the AC entry and utility interface. They deliver detailed real-time insight with high accuracy, which suits revenue-grade accounting and load profiling. A smart meter at the service entry also gives the utility a clean billing reference, and that reference keeps your internal branch figures honest. Branch-level sub-metering at the distribution panel gives you per-feed visibility inside the site. AMI-based analytics work best across a fleet, where aggregated interval data supports benchmarking and trend analysis over time.
Performance, Compliance, and Cost Trade-offs
The table below compares the four approaches on the dimensions that decide most deployments.
Approach | Technical performance | Application fit | Regulatory compliance | Cost |
|---|---|---|---|---|
DC power consumption meters | High-resolution DC branch data with storage and visualization | Rectifier output, battery strings, DC loads | Cyber-secure meters; SCADA integration via DNP 3.0 and Modbus | Moderate hardware, low integration effort |
Smart meters | High accuracy, real-time interval data | AC service entry, billing, load profiling | Medium to high per unit | |
Branch-level sub-metering | Per-feed current and power readings | Inside the distribution panel | Power quality standards such as IEC 61850 where required | Medium to high capex plus installation labor |
AMI-based analytics | Fleet-wide interval data, near-real-time | Multi-site benchmarking and reporting | Regional frameworks such as NIST or EN 62056 | Subscription and data fees, low upfront hardware |
Cost structures differ sharply. District or master metering carries low installation cost and one utility bill. Unit-level electric sub-metering systems add monthly subscription or billing fees plus meter maintenance and recertification. IoT overlays shift spend to a recurring fee with little upfront hardware. Payback depends on local rates and how much consumption you can recover or avoid. A retrofit inside an existing wall is harder than an overlay sensor, so plan the installation route before you commit to a device class.
Compliance shapes the choice as much as price. Power quality monitoring must meet stringent standards, and meters are certified for harmonic analysis, waveform recording, and flicker measurement. Revenue metering demands four-quadrant measurement with transformer and line loss compensation. Telecom data needs cyber-secure meters. Periodic measurements confirm that drift stays within tolerance. Where a site joins a demand response or telemetry program, contractual metering agreements may apply, and the governing documents typically include the tariff metering section and the relevant business practice manuals.
Treat the options as complementary. A power analyzer verifies accuracy at commissioning. A DC meter watches each rectifier. A smart meter anchors the utility boundary. Together they form electricity monitoring solutions that cover the whole chain. Choose power monitor tools by the measurement each branch needs, and the layers reinforce one another.
Results with ESTEL Telecom Rectifier System
Measured Accuracy Gains
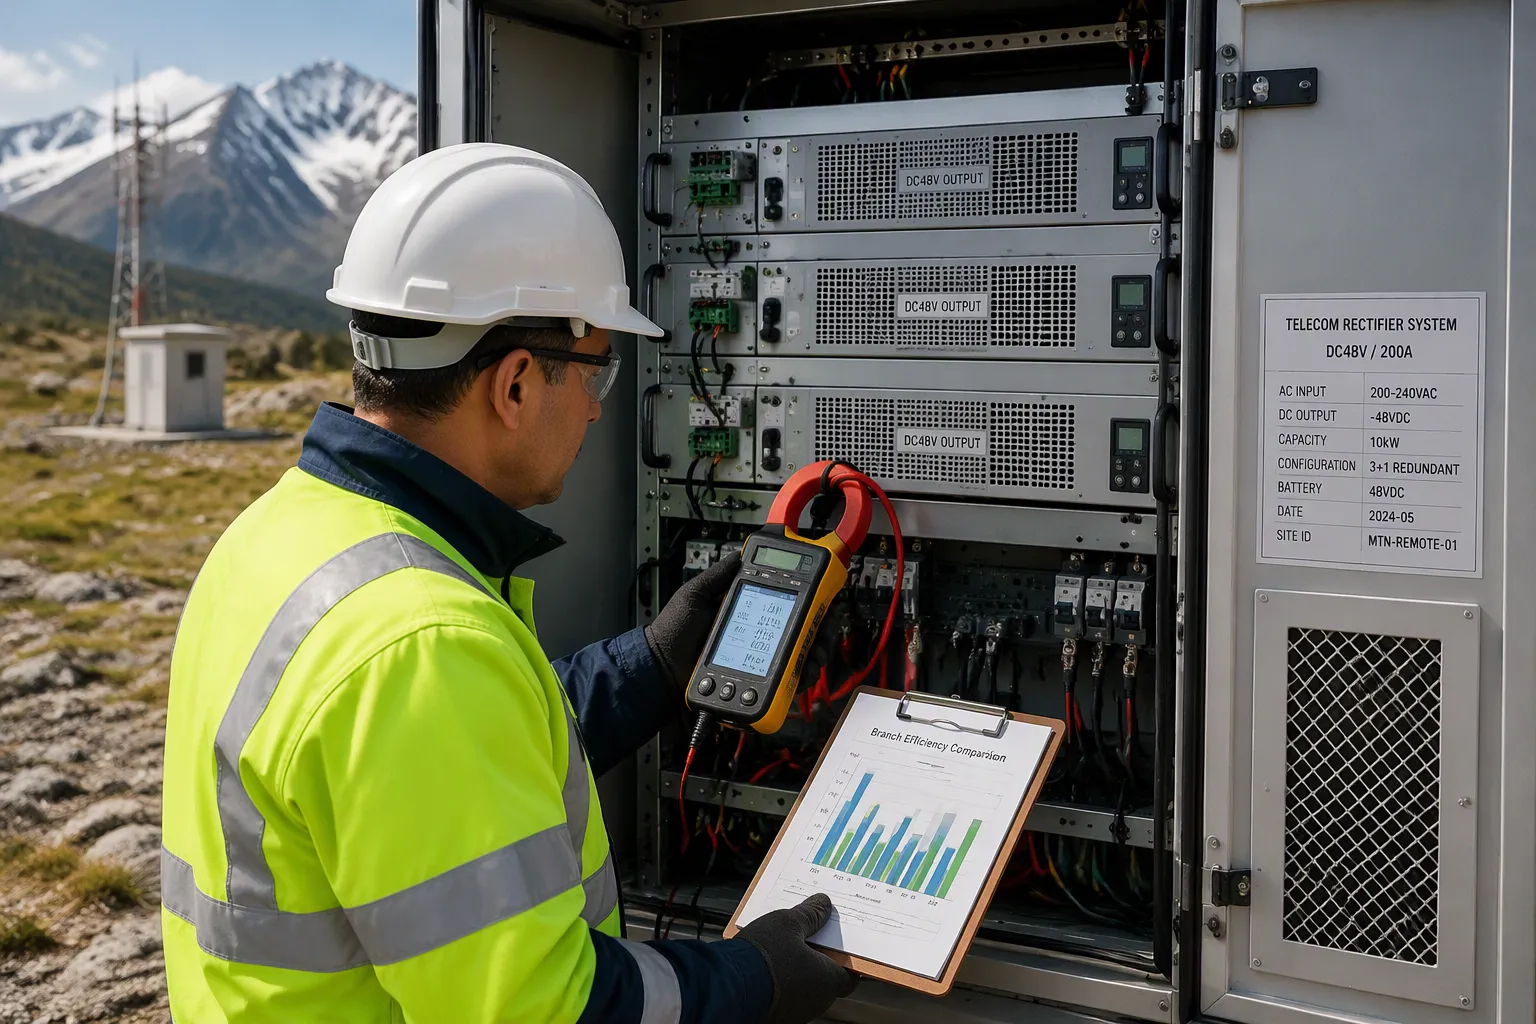
Field results show what branch-level visibility delivers when the rectifier platform itself is efficient. A Southeast Asia outdoor cabinet upgrade replaced legacy units with ESTEL telecom rectifier systems and recorded a 20% reduction in energy costs. The project finished ahead of schedule, cut downtime, and reduced service calls. A remote mountain retrofit installed efficient cooling and power modules, and the infrastructure ran stably through harsh weather while its life extended by several years.
A Southeast Asia outdoor cabinet upgrade recorded a 20% reduction in energy costs. Lower conversion losses reduce cooling load inside the cabinet, which extends component life and cuts maintenance costs. Field data confirms sustained high efficiency under real load conditions.
These outcomes rest on measurable performance. ESTEL systems exceed 96% efficiency, hold a consistent DC48V output, and use a modular 6U/3U/2U rack-mount design with AC220V/380VAC input options and 19-inch rack compatibility. The table below compares key metrics against industry-standard systems.
Metric | ESTEL's Rectifier System | Industry Standard Systems |
|---|---|---|
Conversion Efficiency | 95–96% | |
Power Factor | 0.99 | 0.95 |
Total Harmonic Distortion | 1.12% | 3–5% |
Efficiency in Rectifier Mode | >97% | 95% |
Efficiency in Inverter Mode | >96% | 94% |
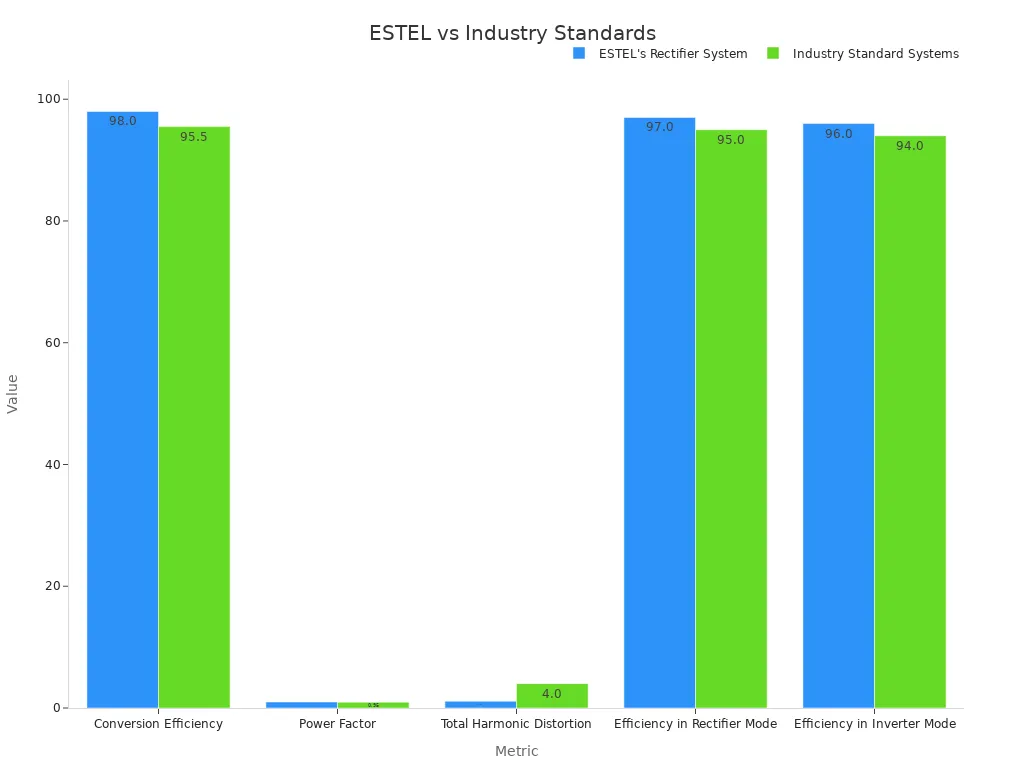
A power analyzer at commissioning confirms these figures on site. Per-branch current readings then show where the efficiency advantage lands. Accurate measurement of each feed turns a site total into accountable lines, and the savings become visible rather than assumed. A consistent DC48V output keeps downstream loads stable.
Deployment and Operational Experience
Deployment ease matters as much as raw performance. Modular design lets you isolate and replace a faulty module quickly, cutting mean time to repair by up to 50%. Hot-swappable modules allow repairs while the network stays operational. Module-level fault identification simplifies troubleshooting and lowers human error risk. An N+1 redundancy configuration keeps supply continuous. Vertical cable management and ZeroU systems free up rack and floor space for future growth.
Operators report concrete gains. A rural Southeast Asian operator using hybrid power systems achieved a 35% operational cost reduction. A European provider during a 5G upgrade saw a 20% decrease in downtime. A small-village telecom company gained 30% longer battery performance with stable connections during storms. A shared tower may serve several operators, and a single total meter cannot show each operator's actual consumption. Energy costs fall with the high-efficiency design, maintenance visits drop for remote sites, and budget planning becomes straightforward with no surprise repair expenses.
Reliability supports this record. The systems carry an MTBF of at least 250,000 hours, ISO9001 and CE certification for intelligent power distribution products, and a 10-year free replacement promise covering rectifier modules, power distribution units, and intelligent monitoring boards. Branch-level sub-metering completes the picture by attributing electricity use to each feed, so every saving stays traceable in your energy consumption records. Routine measurements of each branch confirm that each upgrade pays back.
Enabling Precise Energy Consumption Analysis
Turning Branch Data into Efficiency Insight
Per-feed readings become useful once you convert them into metrics. Each circuit gives you load factor, peak demand, and off-hours draw. You then compare those figures across the network and rank every site against its peers. The table below shows how these practices turn raw readings into optimization decisions.
Practice | How it improves network performance |
|---|---|
Cross-site benchmarking against ENERGY STAR and European standards | Builds a comparable baseline across the whole network and reveals underperforming sites |
Normalization via ISO 50001-aligned regression (climate, floor area, traffic, equipment) | Makes comparisons valid so targets stay realistic rather than distorted by site differences |
Site-specific KPI targets based on benchmark position | Tailors goals to each site's realistic potential and improves target uptake |
Off-hours base load analysis with automatic anomaly alerts | Detects waste outside operating hours and flags abnormal draw for quick remediation |
ATM profiling by location type (indoor vs outdoor) | Optimizes distributed endpoints separately from main buildings |
Prioritizing least-efficient sites first, proving fast ROI, then scaling | Directs investment where savings are largest and enables network-wide rollout |
Per-site, per-region, and institution-wide tracking with live project ROI | Enables monitoring, justification, and scaling of projects across the network |
AMI data repositories hold multiple years of interval data. That history supports advanced analytics for smart meter data, including seasonal baselines and drift detection. Long records also let you test whether a change actually moved the numbers.
A Practical Path to Deployment
Start where the savings are largest. Rank sites by benchmark position, fix the worst performers first, and document the payback. That early proof funds the wider rollout. Add sub-metering at the distribution panel next, then layer DC meters on each rectifier output.
Keep the data proportionate. Fine-grained electricity usage information can identify households, so collect only what your analysis needs. Pair periodic measurements with a power analyzer to confirm accuracy. Off-hours consumption alerts catch waste between service visits. Use energy profiling to separate indoor and outdoor endpoints, and treat electricity as a managed cost rather than a fixed bill.
Each cycle of ranking, targeting, and verifying tightens your picture. Precise analysis then becomes a routine, not a project.
Branch-level statistics close the gap between a site total and real insight. You see each rectifier, each load, and each feed as its own line of data. That visibility turns a vague aggregate into numbers you can act on. Complementary solutions make this practical. DC meters, smart meters, sub-metering, and AMI analytics each cover a different part of the power chain. ESTEL's Telecom Rectifier System adds high efficiency and a modular design that supports clean branch measurements. Together they make precise energy consumption analysis achievable in practice. Efficiency work never truly ends. Each ranking cycle sharpens your picture, and each verified saving funds the next round of improvement across your telecom rectifier systems.
FAQ
What do branch-level statistics actually show?
They break a site total into per-rectifier, per-load, and per-distribution-feed figures. Each branch becomes its own line of data. You see where electricity goes, and every kilowatt gets an owner.
Which metering approach fits my site?
Match the device to the job. DC meters watch rectifier output. Smart meters anchor the AC entry. Sub-metering covers the distribution panel. AMI analytics benchmark a fleet. These options complement each other across the power chain.
Does fine-grained metering raise privacy concerns?
Yes. Research on a 2.5M-household dataset found five consecutive half-hourly measurements re-identified over 90% of households. Collect only the data your analysis needs, and keep records proportionate to the task.
How should I start a deployment?
Rank sites by benchmark position and fix the worst performers first. Add sub-metering at the distribution panel, then DC meters on each rectifier. Verify accuracy at commissioning with an analyzer, and document payback on energy consumption.
See Also
Calculating Power Systems and Batteries for Telecom Cabinets
Solar Energy Storage Power Systems for Telecom Cabinets
Essential Features You Should Know About Telecom Power Supplies
Beginner's Guide to Understanding Telecom Power Supply Systems
Grid-Connected Solar Inverter and Battery Systems for Telecom Cabinets
CALL US DIRECTLY
86-13752765943
3A-8, SHUIWAN 1979 SQUARE (PHASE II), NO.111, TAIZI ROAD,SHUIWAN COMMUNITY, ZHAOSHANG STREET, NANSHAN DISTRICT, SHENZHEN, GUANGDONG, CHINA
